

Question: Please show calculations and kindly explain. 10 A process that is considered to be in control measures an ingredient in ounces. Below are the last
Please show calculations and kindly explain.
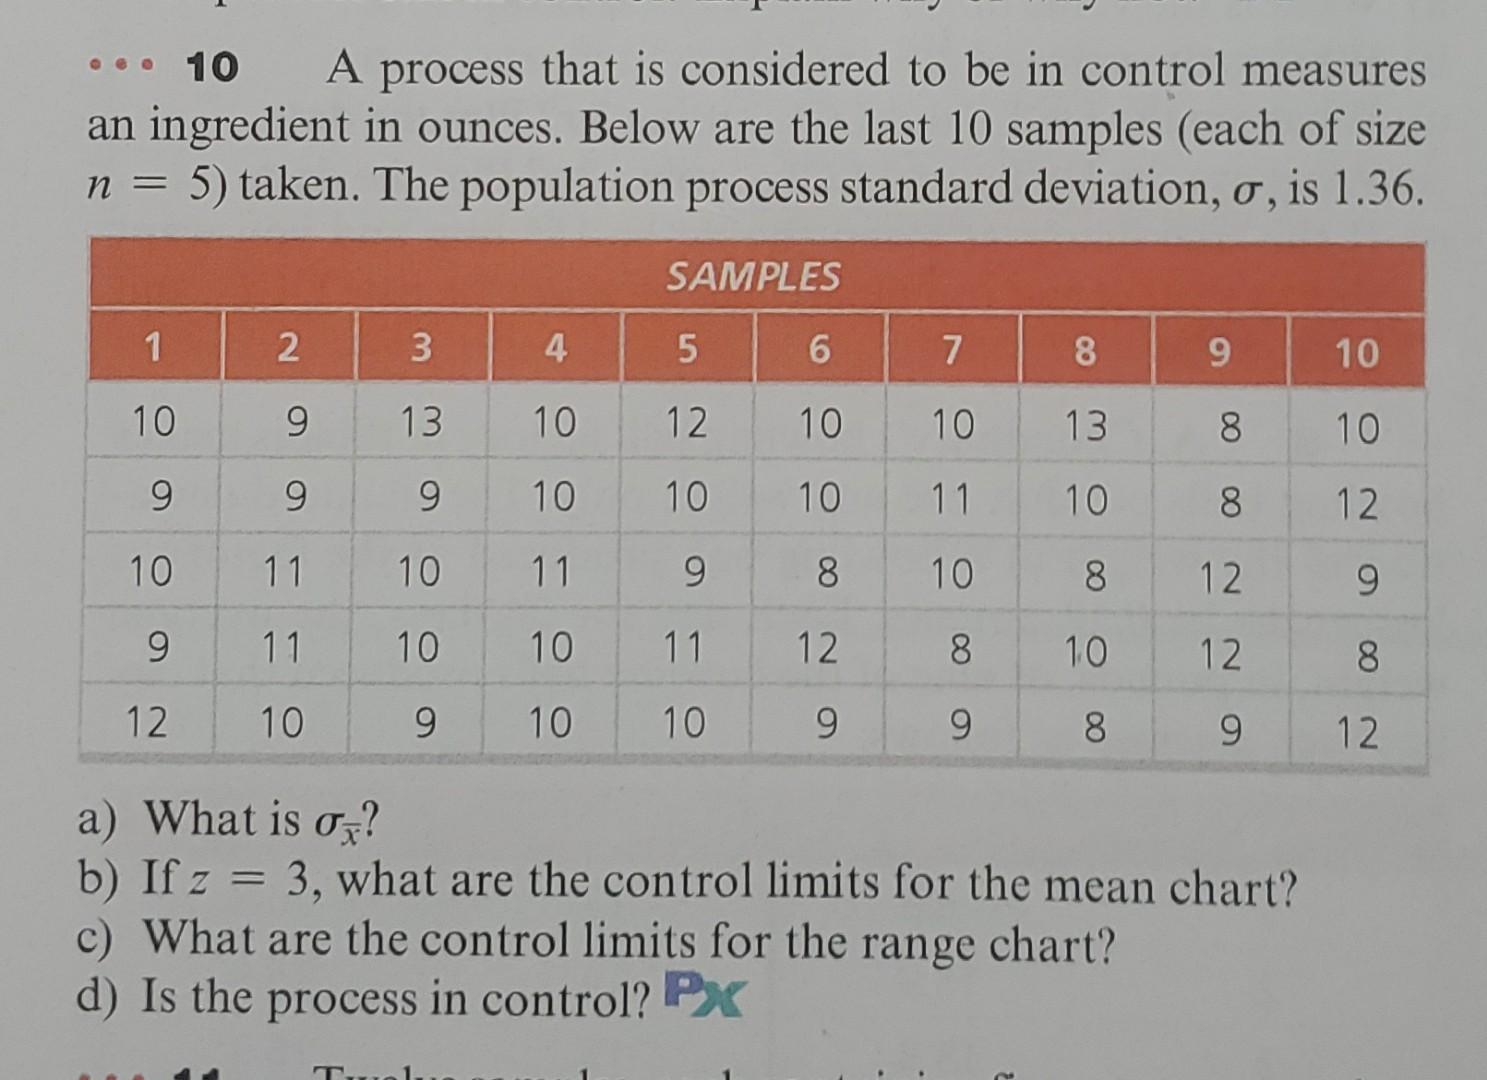
10 A process that is considered to be in control measures an ingredient in ounces. Below are the last 10 samples (each of size n=5 ) taken. The population process standard deviation, , is 1.36 . a) What is x ? b) If z=3, what are the control limits for the mean chart? c) What are the control limits for the range chart? d) Is the process in control? 10 A process that is considered to be in control measures an ingredient in ounces. Below are the last 10 samples (each of size n=5 ) taken. The population process standard deviation, , is 1.36 . a) What is x ? b) If z=3, what are the control limits for the mean chart? c) What are the control limits for the range chart? d) Is the process in control
Step by Step Solution
There are 3 Steps involved in it

Get step-by-step solutions from verified subject matter experts