

Question: please solve it as soon as possible i will upvote. Draw the Average and Range (X & R) control chart for following variable data. (For
please solve it as soon as possible i will upvote.
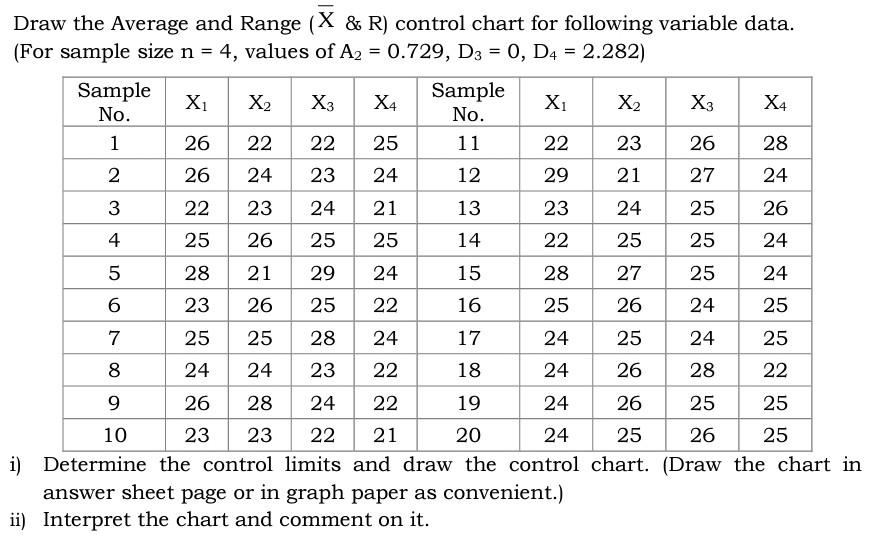
Draw the Average and Range (X & R) control chart for following variable data. (For sample size n = 4, values of A2 = 0.729, D3 = 0, D4 = 2.282) Sample No. X1 X2 X3 X4 Sample No. X X2 X3 X4 1 26 22 22 25 11 22 23 26 28 2 26 24 23 24 12 29 21 27 24 3 22 23 24 21 13 23 24 25 26 4 25 26 25 25 14 22 25 25 24 5 28 21 29 24 15 28 27 25 24 6 23 26 25 22 16 25 26 24 25 7 25 25 28 24 17 24 25 24 25 8 24 24 23 22 18 24 26 28 22 9 26 28 24 22 19 24 26 25 10 23 23 22 21 20 24 25 26 25 i) Determine the control limits and draw the control chart. (Draw the chart in answer sheet page or in graph paper as convenient.) ii) Interpret the chart and comment on it. 25Step by Step Solution
There are 3 Steps involved in it
1 Expert Approved Answer
Step: 1 Unlock

Question Has Been Solved by an Expert!
Get step-by-step solutions from verified subject matter experts
Step: 2 Unlock
Step: 3 Unlock