

Question: Q2. From the table shown i) Shown the network diagram and calculate the critical path (Points 6) Project duration (Point 1) Float of task C
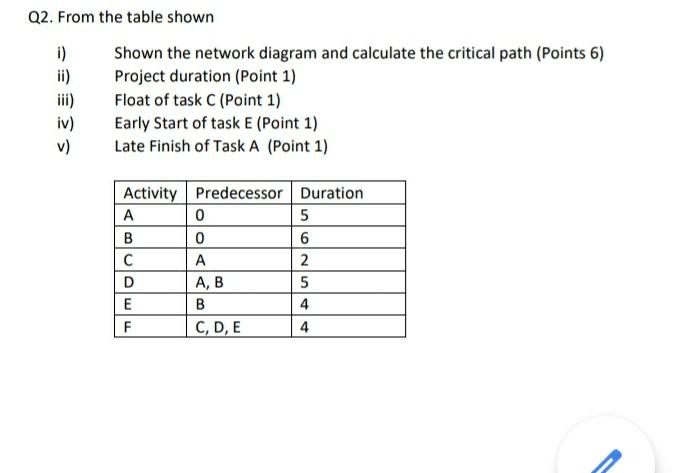
Q2. From the table shown i) Shown the network diagram and calculate the critical path (Points 6) Project duration (Point 1) Float of task C (Point 1) iv) Early Start of task E (Point 1) v) Late Finish of Task A (Point 1) Activity Predecessor Duration A 0 5 B 0 6 . 2 D A,B 5 E B 4 F C, D, E 4
Step by Step Solution
There are 3 Steps involved in it
1 Expert Approved Answer
Step: 1 Unlock

Question Has Been Solved by an Expert!
Get step-by-step solutions from verified subject matter experts
Step: 2 Unlock
Step: 3 Unlock