Question: Quality Improvement by Dale Besterfield (9th ed) Chapter 6 - Control Charts for Variables Question 26: Determine the trial central line and control limits for

Quality Improvement by Dale Besterfield (9th ed) Chapter 6 - Control Charts for Variables

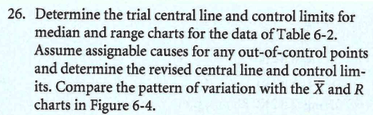
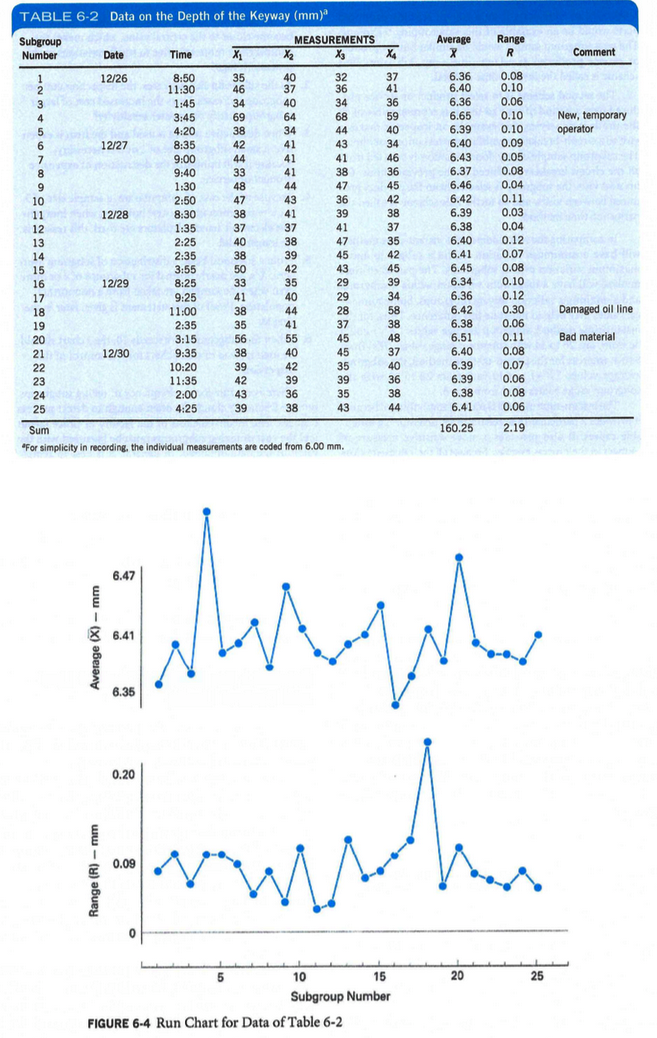
Question 26: Determine the trial central line and control limits for median and range charts for the data of Table 6-2. Assume assignable causes for any out-of-control points and determine the revised central line and control lim- its. Compare the pattern of variation with the X and R charts in Figure 6-4.

Quality Improvement by Dale Besterfield (9th ed) Quality Improvement by Dale Besterfield (9th ed)

26. Determine the trial central line and control limits for median and range charts for the data of Table 6-2. Assume assignable causes for any out-of-control points and determine the revised central line and control lim- its. Compare the pattern of variation with the X and R charts in Figure 6-4. Average X Range R X4 Comment New, temporary operator TABLE 6-2 Data on the Depth of the Keyway (mm) Subgroup MEASUREMENTS Number Date Time X1 X2 X3 1 12/26 8:50 35 40 32 2 11:30 46 37 36 3 3 1:45 34 40 34 4 3:45 69 64 68 5 4:20 38 34 44 6 12/27 8:35 42 41 43 7 9:00 44 41 41 8 9:40 33 41 38 9 1:30 48 44 47 10 2:50 47 43 36 11 12/28 8:30 38 41 39 12 1:35 37 37 41 13 2:25 40 38 47 14 2:35 38 39 45 15 3:55 50 42 43 16 12/29 8:25 33 35 29 17 9:25 41 40 29 18 11:00 38 44 28 19 2:35 35 41 37 20 3:15 56 55 45 21 12/30 9:35 38 40 45 22 10:20 39 42 35 23 11:35 42 39 39 24 2:00 43 36 35 25 4:25 39 38 43 37 41 36 59 40 34 46 36 45 42 38 37 35 42 45 39 34 58 38 48 37 40 36 38 44 6.36 6.40 6.36 6.65 6.39 6.40 6.43 6.37 6.46 6.42 6.39 6.38 6.40 6.41 6.45 6.34 6.36 6.42 6.38 6.51 6.40 6.39 6.39 6.38 6.41 160.25 0.08 0.10 0.06 0.10 0.10 0.09 0.05 0.08 0.04 0.11 0.03 0.04 0.12 0.07 0.08 0.10 0.12 0.30 0.06 0.11 0.08 0.07 0.06 0.08 0.06 Damaged oil line Bad material 2.19 Sum "For simplicity in recording, the individual measurements are coded from 6.00 mm. 6.47 X 6.41 6.35 Arusha 20 25 5 10 15 Subgroup Number FIGURE 6-4 Run Chart for Data of Table 6-2

Step by Step Solution

There are 3 Steps involved in it

1 Expert Approved Answer
Step: 1 Unlock blur-text-image
Question Has Been Solved by an Expert!

Get step-by-step solutions from verified subject matter experts

Step: 2 Unlock
Step: 3 Unlock

Students Have Also Explored These Related General Management Questions!