

Question: Q7. A) Sample data from a manufacturing facility is provided below: Calculate the UCL & LCL and the CL for both the mean (x) and
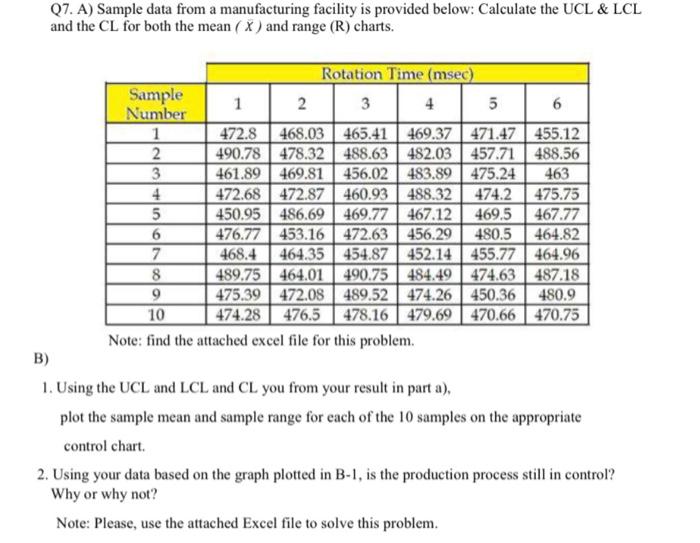
Q7. A) Sample data from a manufacturing facility is provided below: Calculate the UCL \& LCL and the CL for both the mean (x) and range (R) charts. B) Note: find the attached excel file for this problem. 1. Using the UCL and LCL and CL you from your result in part a), plot the sample mean and sample range for each of the 10 samples on the appropriate control chart. 2. Using your data based on the graph plotted in B-1, is the production process still in control? Why or why not? Note: Please, use the attached Excel file to solve this
Step by Step Solution
There are 3 Steps involved in it
1 Expert Approved Answer
Step: 1 Unlock

Question Has Been Solved by an Expert!
Get step-by-step solutions from verified subject matter experts
Step: 2 Unlock
Step: 3 Unlock