

Question: Question 1. Draw the Future ( VSM ) Value Stream Mapping for the current one , and explain the steps in details. 90/60/30 days forecast
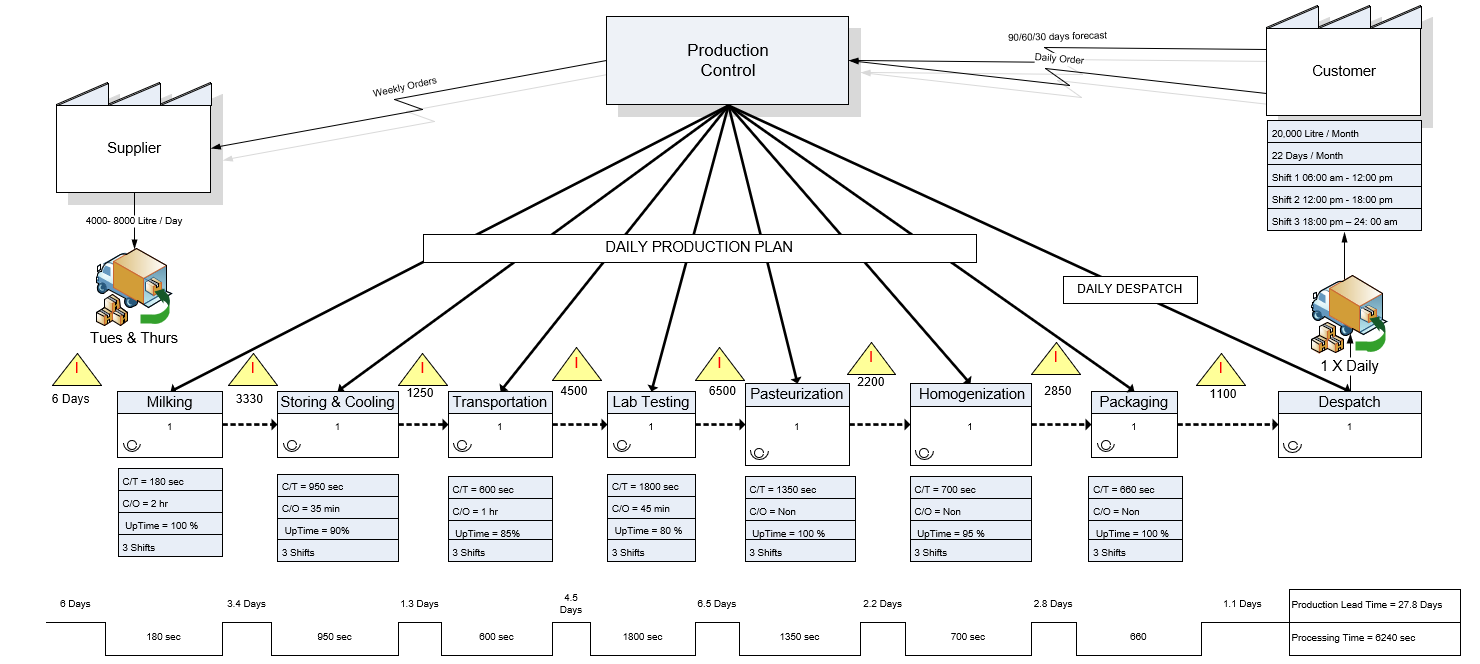
Question 1. Draw the Future ( VSM ) Value Stream Mapping for the current one , and explain the steps in details.
Step by Step Solution
There are 3 Steps involved in it
1 Expert Approved Answer
Step: 1 Unlock

Question Has Been Solved by an Expert!
Get step-by-step solutions from verified subject matter experts
Step: 2 Unlock
Step: 3 Unlock