

Question: Question 1: Required For this question, you will develop a program to calculate some statistics for a csv file. As an example, the csv file
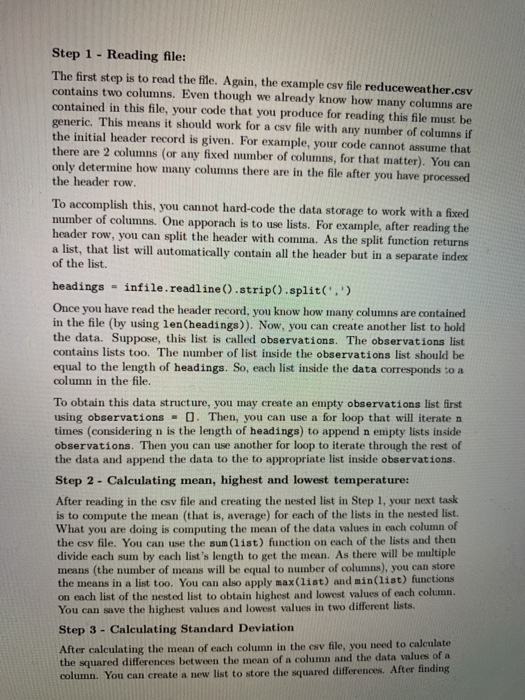
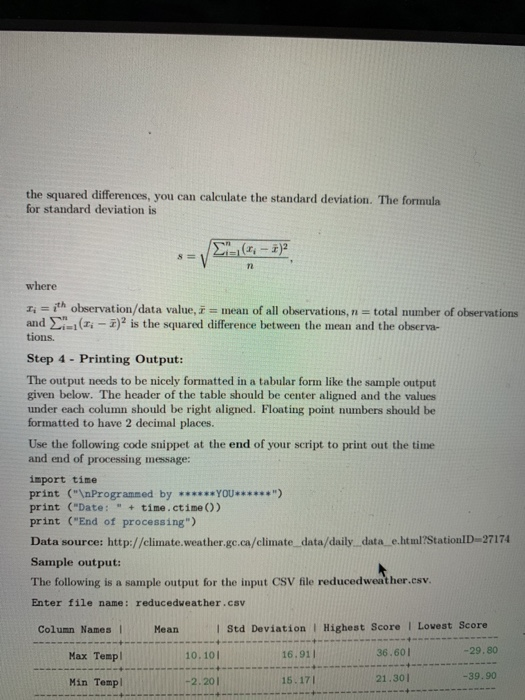
Question 1: Required For this question, you will develop a program to calculate some statistics for a csv file. As an example, the csv file reduced weather.csv contains tabular data which includes Manitoba daily minimum and maximum temperatures (2 columns) from Jan until Sept 17 in 2019. The first row is a header record (row), with headings Max Temp and Min Temp. This is known as the header record. After the header row, each row is a day where maximum and minimum temperature for that day is recorded. From this file, you need to calculate mean. standard deviation, highest and lowest temperature for each column. You may assume that each csv file that your program reads will have a header record with a fixed number of columns, say e columns, and the remaining rows each consists of c columns of numerical data values (also known as observations). To aid you in developing your program, we provide the details in the following 4 steps. Step 1 - Reading file: The first step is to read the file. Again, the example csv file reduce weather.csv contains two columns. Even though we already know how many columns are contained in this file, your code that you produce for reading this file must be generic. This means it should work for a csv file with any number of columns if the initial header record is given. For example, your code cannot assume that there are 2 columns (or any fixed number of columns, for that matter). You can only determine how many columns there are in the file after you have processed the header row. To accomplish this, you cannot hard-code the data storage to work with a fixed number of columns. One apporach is to use lists. For example, after reading the header row, you can split the header with comma. As the split function returns a list, that list will automatically contain all the header but in a separate index of the list. headings - infile.readline().strip().split('.' Once you have read the header record, you know how many columns are contained in the file (by using len(headings)). Now, you can create another list to hold the data. Suppose, this list is called observations. The observations list contains lists too. The number of list inside the observations list should be equal to the length of headings. So, each list inside the data corresponds to a column in the file. To obtain this data structure, you may create an empty observations list first using observations - O. Then, you can use a for loop that will iteraten times (considering n is the length of headings) to append n empty lists inside observations. Then you can use another for loop to iterate through the rest of the data and append the data to the to appropriate list inside observations. Step 2 - Calculating mean, highest and lowest temperature: After reading in the csv file and creating the nested list in Step 1, your next task is to compute the mean (that is, average) for each of the lists in the nested list. What you are doing is computing the mean of the data values in each column of the csv file. You can use the sum (list) function on each of the lists and then divide each sum by each list's length to get the mean. As there will be multiple means the number of means will be equal to number of columns), you can store the means in a list too. You can also apply max(list) and min(list) functions on each list of the nested list to obtain highest and lowest values of each column. You can save the highest values and lowest values in two different lists. Step 3 - Calculating Standard Deviation After calculating the mean of each column in the csv file, you need to calculate the squared differences between the mean of a column and the data values of a column. You can create a new list to store the squared differences. After finding the squared differences, you can calculate the standard deviation. The formula for standard deviation is 8= .( where Ti =ith observation/data value, mean of all observations, n = total number of observations and ti - )" is the squared difference between the mean and the observa- tions. Step 4 - Printing Output: The output needs to be nicely formatted in a tabular form like the sample output given below. The header of the table should be center aligned and the values under each column should be right aligned. Floating point numbers should be formatted to have 2 decimal places. Use the following code snippet at the end of your script to print out the time and end of processing message: import time print (" Programmed by ******YOU******") print ("Date: " + time.ctime()) print ("End of processing") Data source: http://climate.weather.gc.ca/climate data/daily._data_e.html?Station D-27174 Sample output: The following is a sample output for the input CSV file reduced weather.csv. Enter file name: reducedweather.csv Column Names Mean I Std Deviation Highest Score 1 Lowest Score Max Temp 10.101 16.91 36.601 -29.80 Min Temp! -39.90 15.171 -2.201 21.30
Step by Step Solution
There are 3 Steps involved in it

Get step-by-step solutions from verified subject matter experts