

Question: Question 2 ( 4 points ) Given the Activity o n Arrow Diagram and the data found i n the table above, calculate each o
Question points
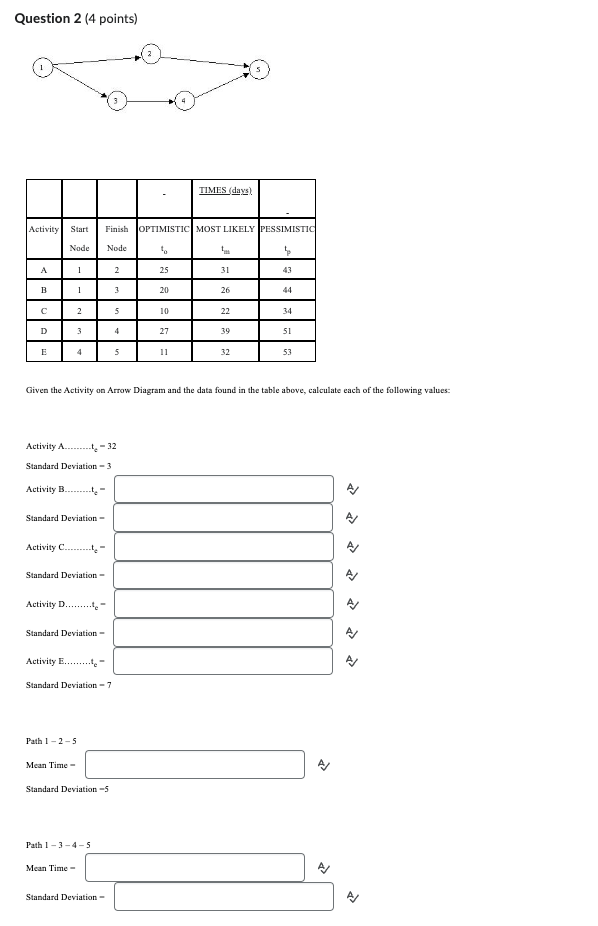
Given the Activity Arrow Diagram and the data found the table above, calculate each the following values:
Activity
Standard Deviation
Activity
Standard Deviation
Activity
Standard Deviation
Activity
Standard Deviation
Activity
Standard Deviation
Path
Mean Time
Standard Deviation
Path
Mean Time
Standard Deviation
Step by Step Solution
There are 3 Steps involved in it
1 Expert Approved Answer
Step: 1 Unlock

Question Has Been Solved by an Expert!
Get step-by-step solutions from verified subject matter experts
Step: 2 Unlock
Step: 3 Unlock