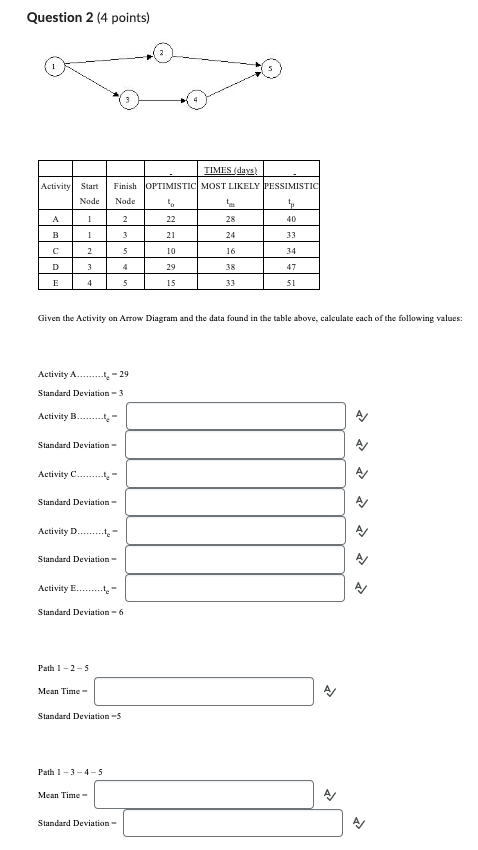
Question: Question 2 (4 points) Given the Activity on Arrow Diagram and the data found in the table above, calculate each of the following values: Activity

Question 2 (4 points) Given the Activity on Arrow

Question 2 (4 points) Given the Activity on Arrow Diagram and the data found in the table above, calculate each of the following values: Activity A.......t Ae=29 Standard Deviation 3 Activity Bte={ A Activity C te= Standard Deviation = Activity D Standard Deviation - A. Activity E... IA Standard Deviation 6 Path 125 Mean Time = Standard Deviation 5 Path 1345 Mean Time = Standard Deviation - A)

Step by Step Solution

There are 3 Steps involved in it

1 Expert Approved Answer
Step: 1 Unlock blur-text-image
Question Has Been Solved by an Expert!

Get step-by-step solutions from verified subject matter experts

Step: 2 Unlock
Step: 3 Unlock

Students Have Also Explored These Related General Management Questions!