

Question: Question 2 options: Pic TIMES ( days ) Activity Start Node Finish Node OPTIMISTIC to MOST LIKELY tm PESSIMISTIC tp A 1 2 2 3
Question options:
Pic
TIMES days
Activity
Start Node
Finish Node
OPTIMISTIC
to
MOST LIKELY
tm
PESSIMISTIC
tp
A
B
C
D
E
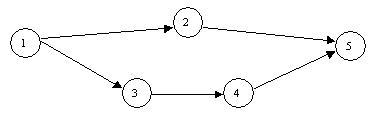
Given the Activity on Arrow Diagram and the data found in the table above, calculate each of the following values:
Activity Ate
Standard Deviation
Activity Bte
Standard Deviation
Activity Cte
Standard Deviation
Activity Dte
Standard Deviation
Activity Ete
Standard Deviation
Path
Mean Time
Standard Deviation
Path
Mean Time
Standard Deviation
Step by Step Solution
There are 3 Steps involved in it
1 Expert Approved Answer
Step: 1 Unlock

Question Has Been Solved by an Expert!
Get step-by-step solutions from verified subject matter experts
Step: 2 Unlock
Step: 3 Unlock