

Question: Question 2 ( 6 0 marks ) you may submit a single Excel file with organized layout and clearly labelled answers to different parts of
Question marks you may submit a single Excel file with organized layout and clearly labelled
answers to different parts of the question
A crossharbour tunnel has implemented a timevarying toll for arriving vehicles. Simulating
vehicle arrivals to the automatic toll collection system can help estimate the revenue and
vehicle waiting time during a morning peak period, given the past distribution of time between
vehicle arrivals or interarrival time to a single lane at the entrance of the tunnel in Table
For simplicity, consider only two major types of vehicles arriving at the single lane. The
distribution of private cars and goods vehicles are and respectively.
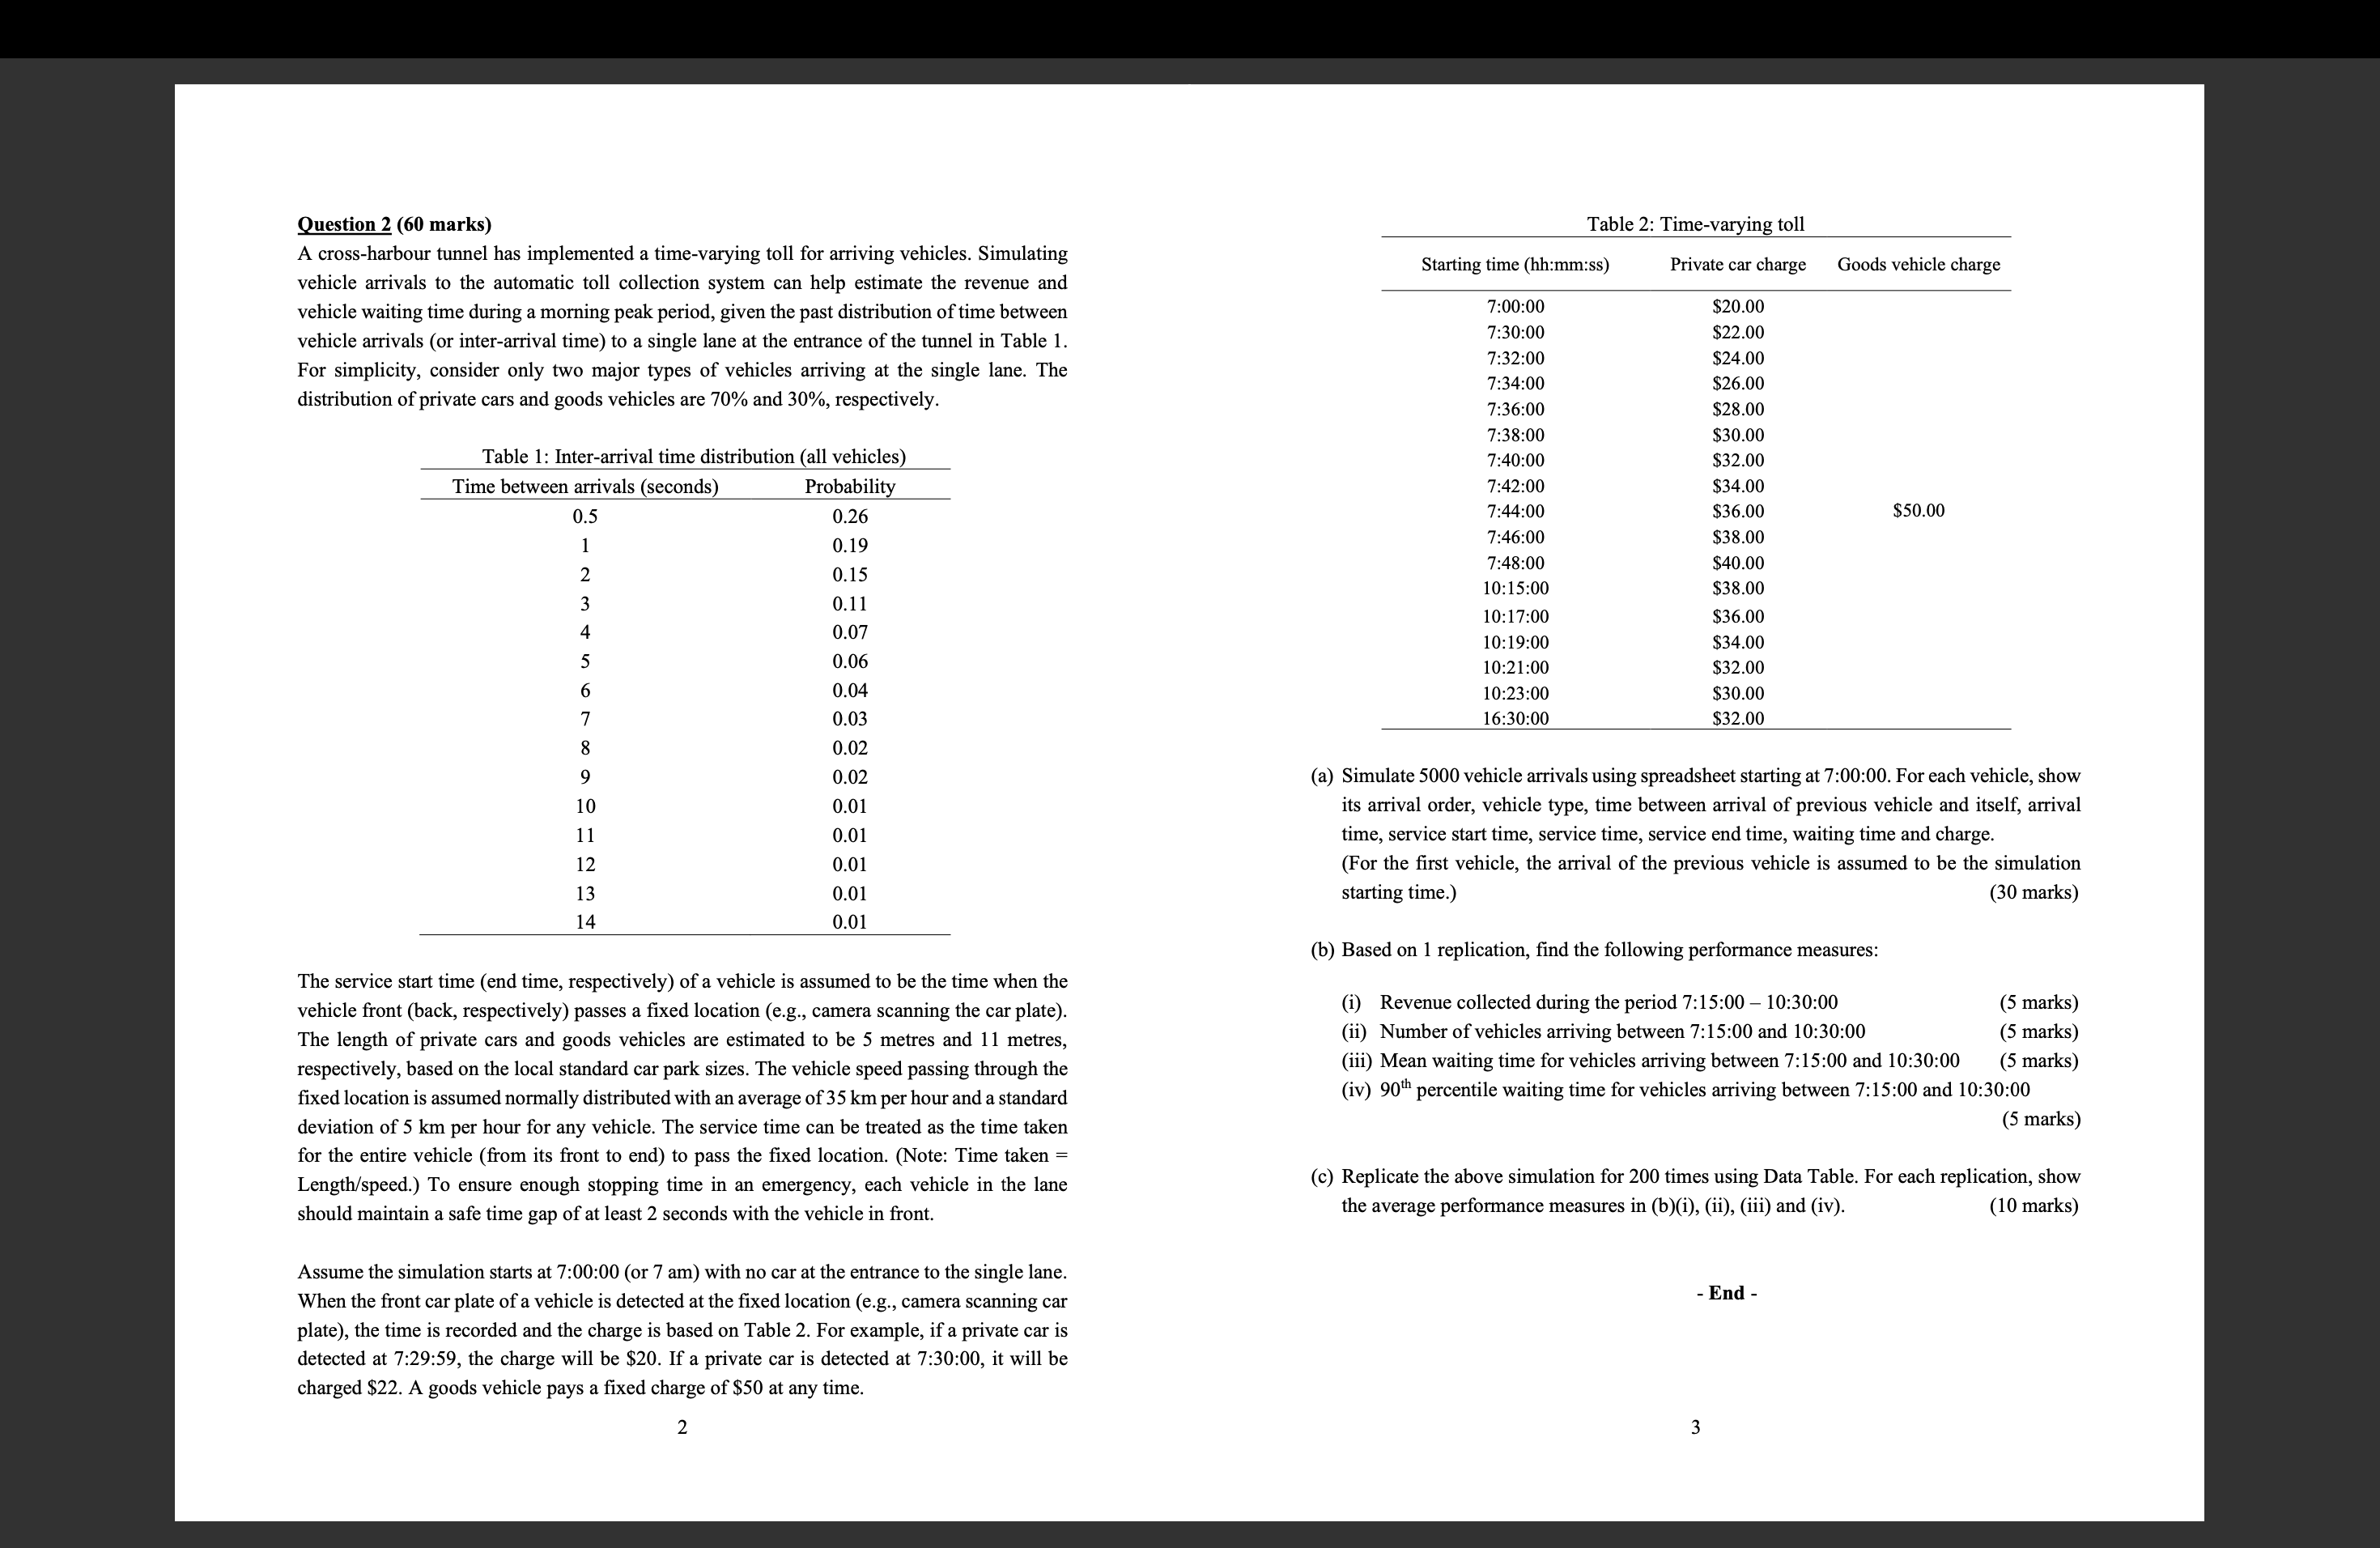
Table : Interarrival time distribution all vehicles
The service start time end time, respectively of a vehicle is assumed to be the time when the
vehicle front back respectively passes a fixed location eg camera scanning the car plate
The length of private cars and goods vehicles are estimated to be metres and metres,
respectively, based on the local standard car park sizes. The vehicle speed passing through the
fixed location is assumed normally distributed with an average of per hour and a standard
deviation of per hour for any vehicle. The service time can be treated as the time taken
for the entire vehicle from its front to end to pass the fixed location. Note: Time taken
Lengthspeed To ensure enough stopping time in an emergency, each vehicle in the lane
should maintain a safe time gap of at least seconds with the vehicle in front.
Assume the simulation starts at ::or with no car at the entrance to the single lane.
When the front car plate of a vehicle is detected at the fixed location eg camera scanning car
plate the time is recorded and the charge is based on Table For example, if a private car is
detected at :: the charge will be $ If a private car is detected at :: it will be
charged $ A goods vehicle pays a fixed charge of $ at any time.
Table : Timevarying toll
a Simulate vehicle arrivals using spreadsheet starting at :: For each vehicle, show
its arrival order, vehicle type, time between arrival of previous vehicle and itself, arrival
time, service start time, service time, service end time, waiting time and charge.
For the first vehicle, the arrival of the previous vehicle is assumed to be the simulation
starting time.
marks
b Based on replication, find the following performance measures:
i Revenue collected during the period ::::
ii Number of vehicles arriving between :: and ::
iii Mean waiting time for vehicles arriving between :: and :: marks
iv percentile waiting time for vehicles arriving between :: and ::
marks
c Replicate the above simulation for times using Data Table. For each replication, show
the average performance measures in biiiiii and iv
marks
Step by Step Solution
There are 3 Steps involved in it
1 Expert Approved Answer
Step: 1 Unlock

Question Has Been Solved by an Expert!
Get step-by-step solutions from verified subject matter experts
Step: 2 Unlock
Step: 3 Unlock