

Question: Question 2: Construct the simulation chart for the customers and servers(details in the attachment) Consider the following Queueing System Data: Queueing Simulation for 3 Servers
Question 2: Construct the simulation chart for the customers and servers(details in the attachment)
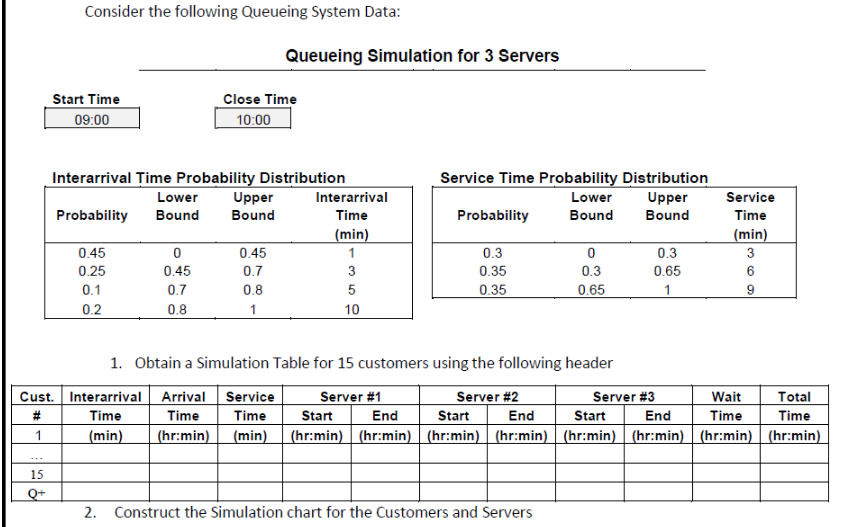
Consider the following Queueing System Data: Queueing Simulation for 3 Servers Start Time 09:00 Close Time 10:00 Interarrival Time Probability Distribution Service Time Probabilitv Distribution 1. Obtain a Simulation Table for 15 customers using the following header 2. Construct the Simulation chart for the Customers and Servers Consider the following Queueing System Data: Queueing Simulation for 3 Servers Start Time 09:00 Close Time 10:00 Interarrival Time Probability Distribution Service Time Probabilitv Distribution 1. Obtain a Simulation Table for 15 customers using the following header 2. Construct the Simulation chart for the Customers and Servers
Step by Step Solution
There are 3 Steps involved in it

Get step-by-step solutions from verified subject matter experts