

Question: TIMES (days) Activity Start Node Finish Node OPTIMISTIC t o MOST LIKELY t m PESSIMISTIC t p A 1 2 23 32 59 B 1
|
|
|
| TIMES (days) |
| |
| Activity | Start Node | Finish Node | OPTIMISTIC to | MOST LIKELY tm | PESSIMISTIC tp |
| A | 1 | 2 | 23 | 32 | 59 |
| B | 1 | 3 | 15 | 18 | 27 |
| C | 2 | 5 | 19 | 31 | 67 |
| D | 3 | 4 | 28 | 46 | 64 |
| E | 4 | 5 | 15 | 42 | 69 |
Given the Activity on Arrow Diagram and the data found in the table above, calculate each of the following values: Activity Ate = 35 Standard Deviation = 6
Activity Bte =
Standard Deviation =
Activity Cte = Standard Deviation =
Activity Dte = Standard Deviation =
Activity Ete = 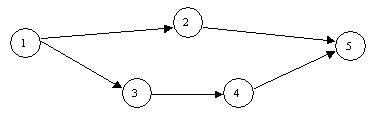
Standard Deviation = 9
Path 1 2 5 Mean Time =
Standard Deviation =10
Path 1 3 4 5 Mean Time =
Standard Deviation =
2Step by Step Solution
There are 3 Steps involved in it
1 Expert Approved Answer
Step: 1 Unlock

Question Has Been Solved by an Expert!
Get step-by-step solutions from verified subject matter experts
Step: 2 Unlock
Step: 3 Unlock