

Question: B. In Chart B below, the average 30-year mortgage rate over the last 10 years are shown. A Linear trend line is added to forecast
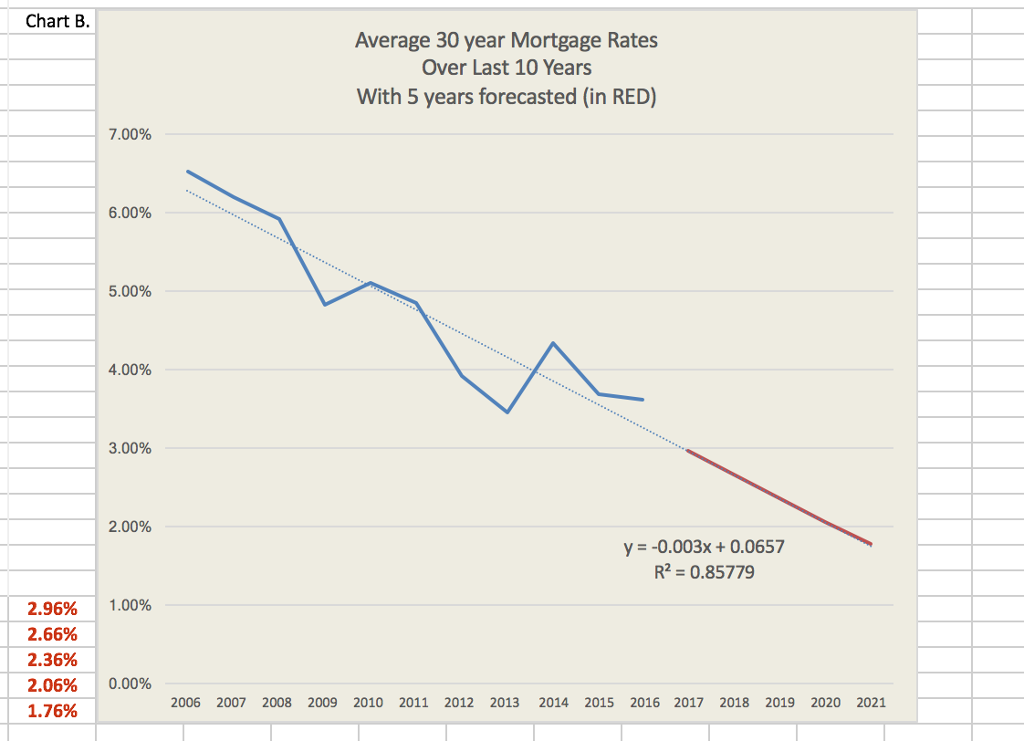 B. In Chart B below, the average 30-year mortgage rate over the last 10 years are shown. A "Linear" trend line is added to "forecast" years 2017 thru 2021.
(4) B-1: Through observation, provide TWO key reasons this forecast is considered flawed.
(2) B-2: As Project Manager, Monte Carlo simulation has demonstrated that project success (NPV) is highly sensitive to interest rates. In 100 words, what other means would you use to more accurately forecast years 2017 thru 2021?
Chart B Average 30 year Mortgage Rates Over Last 10 Years With 5 years forecasted (in RED) 7.00% 6.00% 5.00% 4.00% 3.00% 2.00% y -0.003x 0.0657 R2 0.85779 2.96% 1.00% 2.66% 2.36% 2.06% 0.00% 2006 2007 2008 2009 2010 2011 2012 2013 2014 2015 2016 2017 2018 2019 2020 2021 1.76%
Step by Step Solution
There are 3 Steps involved in it

Get step-by-step solutions from verified subject matter experts