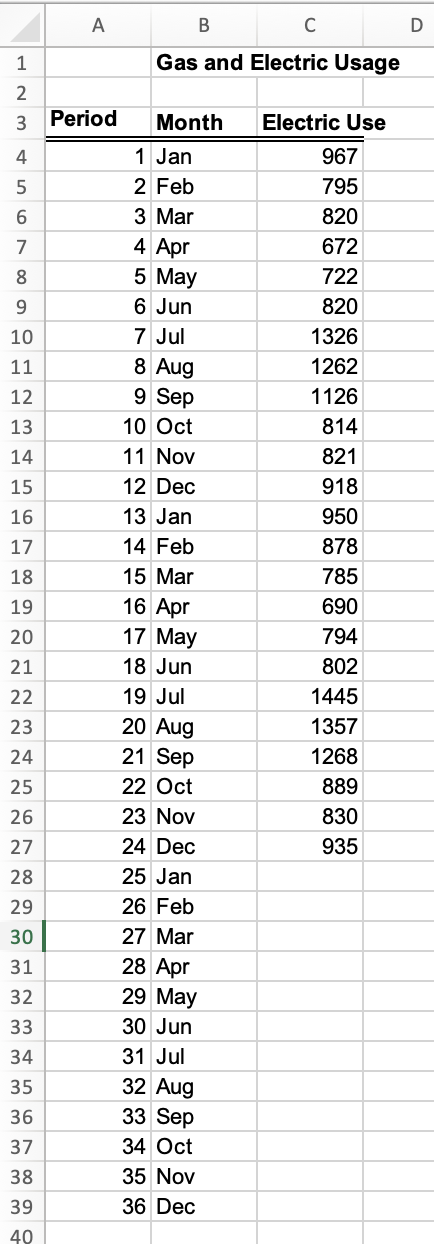
Question: Question 4: Plot the graph for data provided in Gas and Electrics file. What method would be best to forecast for the next 12 months?

Question 4: Plot the graph for data provided inQuestion 4: Plot the graph for data provided in

Question 4: Plot the graph for data provided in Gas and Electrics file. What method would be best to forecast for the next 12 months? And what are your forecasts for the next 12 months for the Gas and Electric Usage. A B c C 1 Gas and Electric Usage 2 Nm 3 Period Month Electric Use 4 5 6 7 8 9 10 11 12 13 14 967 795 820 672 722 820 1326 1262 1126 814 821 918 950 878 785 690 794 802 1445 1357 1268 889 15 16 17 18 19 1 Jan 2 Feb 3 Mar 4 Apr 5 May 6 Jun 7 Jul 8 Aug 9 Sep 10 Oct 11 Nov 12 Dec 13 Jan 14 Feb 15 Mar 16 Apr 17 May 18 Jun 19 Jul 20 Aug 21 Sep 22 Oct 23 Nov 24 Dec 25 Jan 26 Feb 27 Mar 28 Apr 29 May 30 Jun 31 Jul 32 Aug 33 Sep 34 Oct 35 Nov 36 Dec 20 21 22 23 830 935 24 25 26 27 28 29 30 31 32 33 34 35 36 37 38 39 40

Step by Step Solution

There are 3 Steps involved in it

1 Expert Approved Answer
Step: 1 Unlock blur-text-image
Question Has Been Solved by an Expert!

Get step-by-step solutions from verified subject matter experts

Step: 2 Unlock
Step: 3 Unlock

Students Have Also Explored These Related General Management Questions!