

Question: Question 4 QUESTION 4 The below graph represents the demand and supply for bottles of milk Demand and Supply for Bettles of s 55 50
Question 4 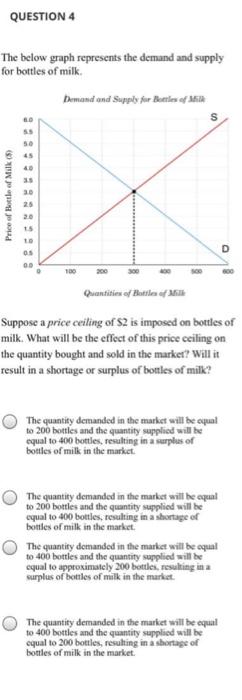
QUESTION 4 The below graph represents the demand and supply for bottles of milk Demand and Supply for Bettles of s 55 50 45 40 Price of Bottle of Milk 25 15 to 05 00 D 100 300 600 Quantities of Battle Suppose a price ceiling of S2 is imposed on bottles of milk. What will be the effect of this price ceiling on the quantity bought and sold in the market? Will it result in a shortage or surplus of bottles of milk? The quantity demanded in the market will be equal to 200 bottles and the quantity supplied will be equal to 400 bottles, resulting in a surplus of bottles of milk in the market The quantity demanded in the market will be equal to 200 bottles and the quantity supplied will be equal to 400 bottles, resulting in a shortage of bottles of milk in the market. The quantity demanded in the market will be equal to 400 bottles and the quantity supplied will be equal to approximately 200 bottles, resulting in a surplus of bottles of milk in the market The quantity demanded in the market will be equal to 400 bottles and the quantity supplied will be equal to 200 bottles, resulting in a shortage of bottles of milk in the market
Step by Step Solution
There are 3 Steps involved in it
1 Expert Approved Answer
Step: 1 Unlock

Question Has Been Solved by an Expert!
Get step-by-step solutions from verified subject matter experts
Step: 2 Unlock
Step: 3 Unlock