

Question: Question #4-Hypothesis Testing (5 marks) Download the dataset advertising,csy . This dataset includes sales data, as well as the budget for TV, Radio and Newspaper
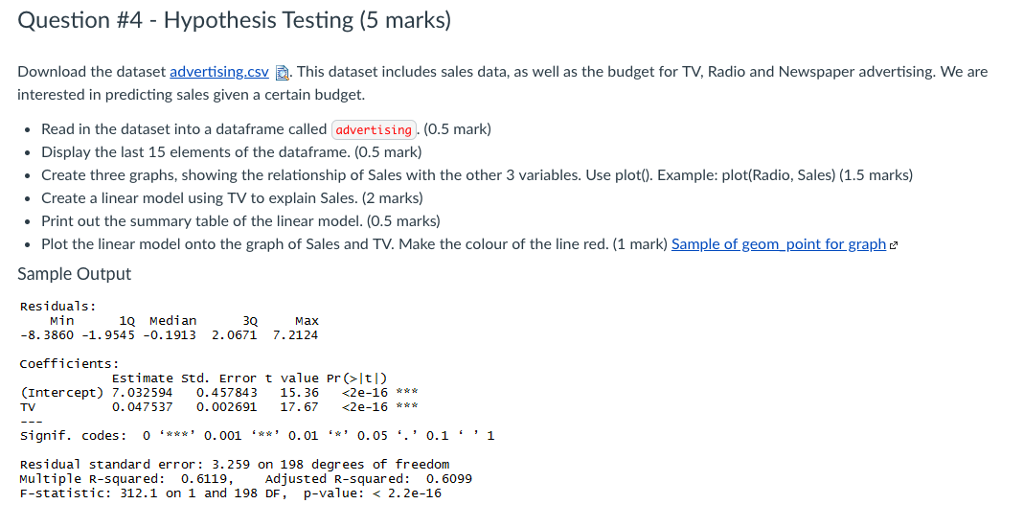
Question #4-Hypothesis Testing (5 marks) Download the dataset advertising,csy . This dataset includes sales data, as well as the budget for TV, Radio and Newspaper advertising. We are interested in predicting sales given a certain budget. Read in the dataset into a dataframe called advertising. (0.5 mark) Display the last 15 elements of the dataframe. (0.5 mark) Create three graphs, showing the relationship of Sales with the other 3 variables. Use plot). Example: plot(Radio, Sales) (1.5 marks) Create a linear model using TV to explain Sales. (2 marks) Print out the summary table of the linear model. (0.5 marks) Plot the linear model onto the graph of Sales and TV. Make the colour of the line red. (1 mark) Sample of geom_point for graph e Sample Output Residuals -8. 3860 -1.9545 -0.1913 2.0671 7.2124 Coefficients: Min 1Q Median 3Q Max Estimate Std. Error t value Pr ltl) (Intercept) 7.032594 0.457843 15. 36
Step by Step Solution
There are 3 Steps involved in it

Get step-by-step solutions from verified subject matter experts