

Question: Question: Considering both the probability value and effect size measure, what interpretations would you make about the findings? That is, what are your conclusions about
Question:
Considering both the probability value and effect size measure, what interpretations would you make about the findings? That is, what are your conclusions about the effects of leaving happy faces on checks?
Recall again that Rind & Bordia (1996) investigated whether or not drawing a happy face on customers' checks increased the amount of tips received by a waitress at an upscale restaurant on a universitycampus. Duringthelunchhourawaitressdrewahappy,smilingfaceonthechecksofa randomhalfofhercustomers. Theremaininghalfofthecustomersreceivedacheckwithnodrawing(18 points).
The tip percentages for the control group (no happy face) are as follows:
45% 39% 36% 34% 34% 33% 31% 31% 30% 30% 28% 28% 28% 27% 27% 25% 23% 22% 21% 21% 20% 18% 8%
The tip percentages for the experimental group (happy face) are as follows:
72% 65% 47% 44% 41% 40% 34% 33% 33% 30% 29% 28% 27% 27% 25% 24% 24% 23% 22% 21% 21% 17%
Group of answer choices
The p value that is calculated for the t-test is dependent on several factors including sample size and effect size. It is very likely that, given the effect size obtained, if the sample size was larger the study would have yielded statistically significant results. Therefore, it appears that the low statistical power (i.e., high Type II error) of the study resulting from the small sample size was probably mainly responsible for the lack of significant findings.
The p value that is calculated for the t-test is dependent on one factor: sample size. It is very likely that, given the large effect size obtained, if the sample size was larger the study would have yielded statistically significant results. Therefore, it appears that the strong statistical power of the study resulting from the small sample size was mainly responsible for the lack of significant findings.
The p value that is calculated for the t-test is dependent on several factors including sample size and effect size. It is very likely that, given the small effect size obtained, if the sample size was smaller the study would have yielded statistically significant results. Therefore, it appears that the low statistical power (i.e., high Type II error) of the study resulting from the large sample size was mainly responsible for the lack of significant findings.
The p value that is calculated for the t-test is dependent on several factors including sample size and effect size. It is very likely that, given the effect size obtained, if the sample size was smaller the study would have yielded statistically significant results. Therefore, it appears that the low statistical power (i.e., high Type II error) of the study resulting from the large sample size was mainly responsible for the lack of significant findings.
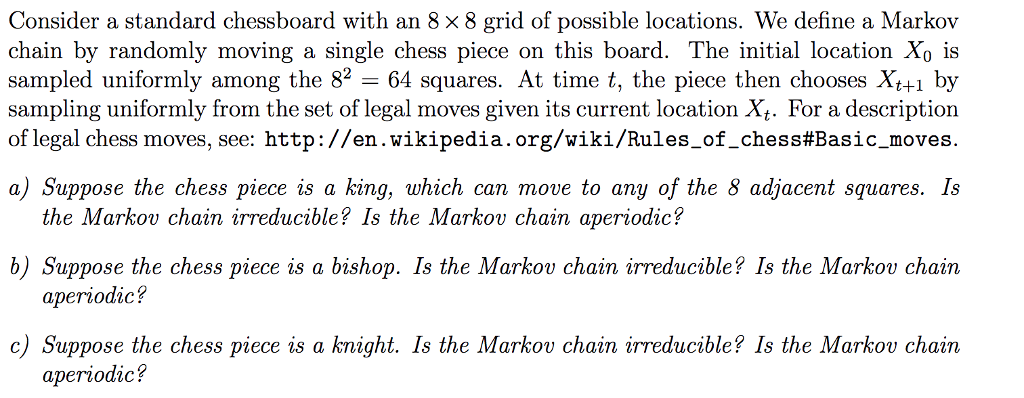
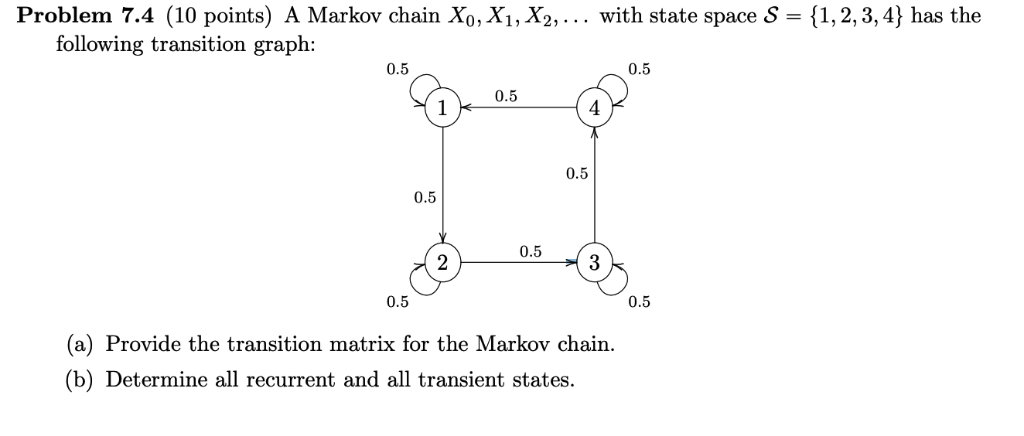
Consider a standard chessboard with an 8 x 8 grid of possible locations. We define a Markov chain by randomly moving a single chess piece on this board. The initial location Xo is sampled uniformly among the 82 = 64 squares. At time t, the piece then chooses Xt+1 by sampling uniformly from the set of legal moves given its current location Xt. For a description of legal chess moves, see: http://en. wikipedia. org/wiki/Rules_of_chess#Basic_moves. a) Suppose the chess piece is a king, which can move to any of the 8 adjacent squares. Is the Markov chain irreducible? Is the Markov chain aperiodic? b) Suppose the chess piece is a bishop. Is the Markov chain irreducible? Is the Markov chain aperiodic? c) Suppose the chess piece is a knight. Is the Markov chain irreducible? Is the Markov chain aperiodic?Problem 7.4 (10 points) A Markov chain X0,X1, X2, . . . with state space S = {1, 2, 3, 4} has the following transition graph: (a) Provide the transitiOn matrix fer the Markov chain. (13) Determine all recurrent and all transient states
Step by Step Solution
There are 3 Steps involved in it

Get step-by-step solutions from verified subject matter experts