

Question: Raw data Batch Reactor: begin{tabular}{|c|c|} hline ElapsedTime(s) & MeasuredConductivity[mS] hline 0 & 11.50 hline 330 & 10.20 hline 660 & 9.20
![Raw data Batch Reactor: \begin{tabular}{|c|c|} \hline ElapsedTime(s) & MeasuredConductivity[mS] \\ \hline](https://dsd5zvtm8ll6.cloudfront.net/si.experts.images/questions/2024/09/66f90cf82e5cd_81566f90cf7bd657.jpg)
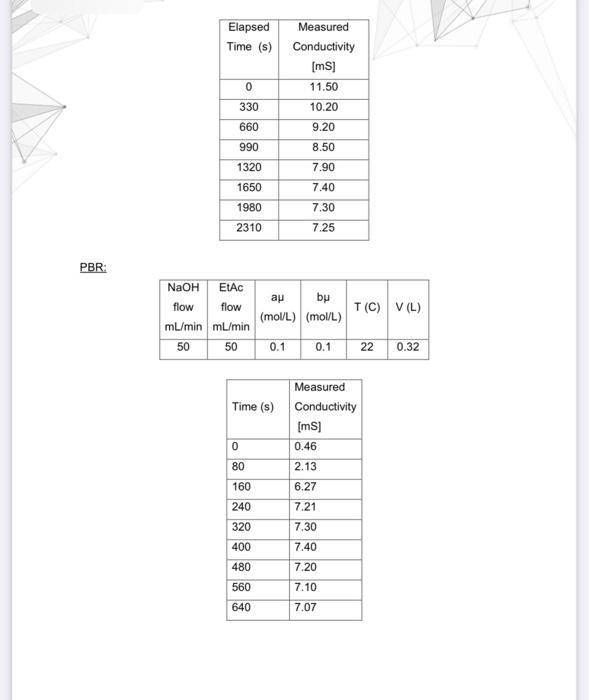

Raw data Batch Reactor: \begin{tabular}{|c|c|} \hline ElapsedTime(s) & MeasuredConductivity[mS] \\ \hline 0 & 11.50 \\ \hline 330 & 10.20 \\ \hline 660 & 9.20 \\ \hline 990 & 8.50 \\ \hline 1320 & 7.90 \\ \hline 1650 & 7.40 \\ \hline 1980 & 7.30 \\ \hline 2310 & 7.25 \\ \hline \end{tabular} PBR: \begin{tabular}{|l|l|} \hline Time (s) & MeasuredConductivity[mS] \\ \hline 0 & 0.46 \\ \hline 80 & 2.13 \\ \hline 160 & 6.27 \\ \hline 240 & 7.21 \\ \hline 320 & 7.30 \\ \hline 400 & 7.40 \\ \hline 480 & 7.20 \\ \hline 560 & 7.10 \\ \hline 640 & 7.07 \\ \hline \end{tabular} - Show reactant concentration change with time for all three types of reactors. - Determine the steady state conversion among all three types of reactors - Determine the reaction rate constant using batch and CSTR. Decide which of them is more accurate and explain why
Step by Step Solution
There are 3 Steps involved in it

Get step-by-step solutions from verified subject matter experts