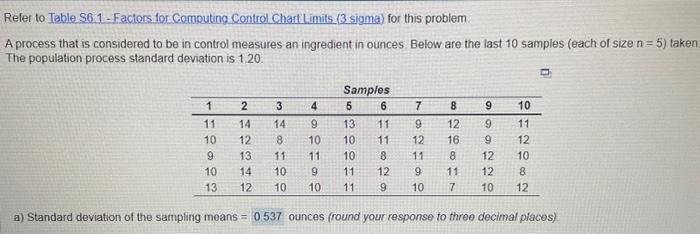
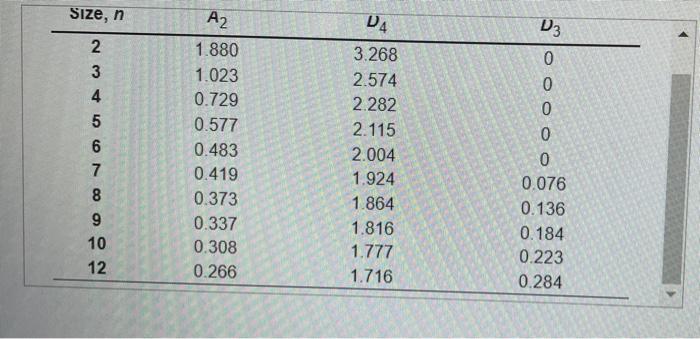
Question: Refer to Table S61 - Factors for Computing Control Chart Limits (3 sigma) for this problem. A process that is considered to be in control

Refer to Table S61 - Factors for Computing
Refer to Table S61 - Factors for Computing Control Chart Limits (3 sigma) for this problem. A process that is considered to be in control measures an ingredient in ounces. Below are the last 10 samples (each of size n=5 ) taken The population process standard deviation is 1.20. a) Standard deviation of the sampling means = ounces (round your response to three decimal places). a) Standard deviation of the sampling means =0.537 ounces (round your response to three decimal places). b) With z=3, the control limits for the mean chart are: UCLx=12.031 ounces (round your response to three decimal places). LCLx=8.100 ounces (round your response to three decimal places). c) The control limits for the R-chart are: UCLR=8.460 ounces (round your response to three decimal places). LCLR=0 ounces (round your response to three decimal places). d) Based on the X-chart, is one or more samples beyond the control limits? Yes Based on the R-chart, is one or more samples beyond the control limits? No Definition \begin{tabular}{cccc} SIZe, n & A2 & D4 & D3 \\ \hline 2 & 1.880 & 3.268 & 0 \\ 3 & 1.023 & 2.574 & 0 \\ 4 & 0.729 & 2.282 & 0 \\ 5 & 0.577 & 2.115 & 0 \\ 6 & 0.483 & 2.004 & 0 \\ 7 & 0.419 & 1.924 & 0.076 \\ 8 & 0.373 & 1.864 & 0.136 \\ 9 & 0.337 & 1.816 & 0.184 \\ 10 & 0.308 & 1.777 & 0.223 \\ 12 & 0.266 & 1.716 & 0.284 \\ \hline \end{tabular}

Step by Step Solution

There are 3 Steps involved in it

1 Expert Approved Answer
Step: 1 Unlock blur-text-image
Question Has Been Solved by an Expert!

Get step-by-step solutions from verified subject matter experts

Step: 2 Unlock
Step: 3 Unlock

Students Have Also Explored These Related General Management Questions!