

Question: Roeshunna v GICS Code Qualitative Numeric GICS Sector Qualitative Nonnumeric 500 SAP 100 Qualitative Nonnumeric 500 variable variable variable Correlation Correlation Using the tool, make

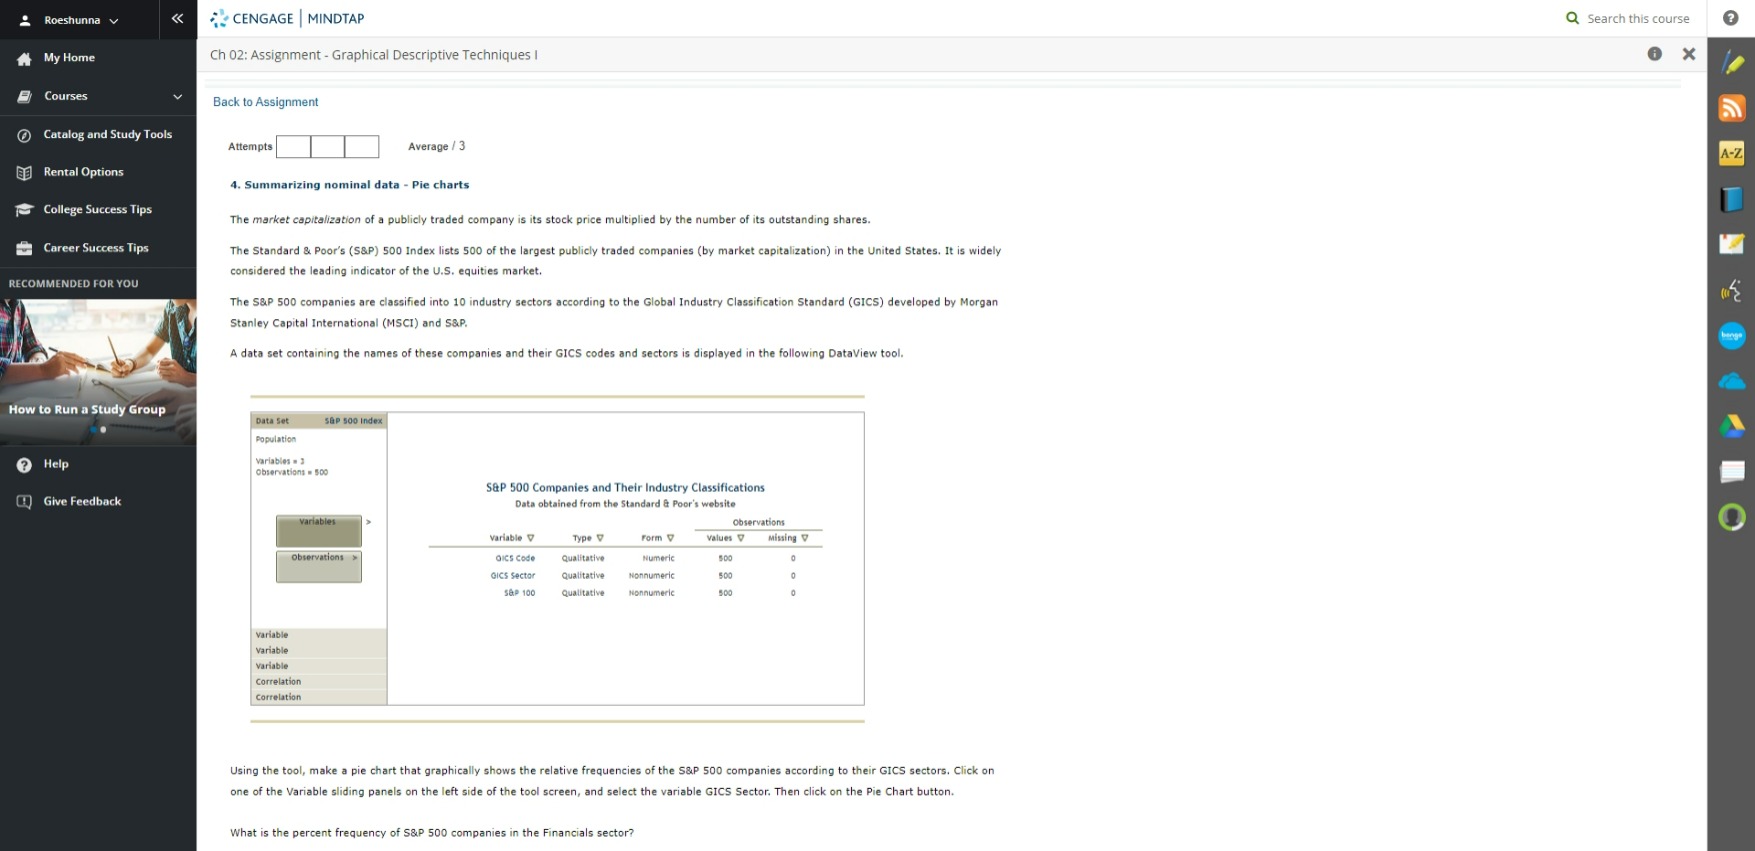
Roeshunna v GICS Code Qualitative Numeric GICS Sector Qualitative Nonnumeric 500 SAP 100 Qualitative Nonnumeric 500 variable variable variable Correlation Correlation Using the tool, make a pie chart that graphically shows the relative frequencies of the S&P 500 companies according to their GICS sectors. Click on one of the Variable sliding panels on the left side of the tool screen, and select the variable GICS Sector. Then click on the Pie Chart button. What is the percent frequency of S&P 500 companies in the Financials sector
Step by Step Solution
There are 3 Steps involved in it
1 Expert Approved Answer
Step: 1 Unlock

Question Has Been Solved by an Expert!
Get step-by-step solutions from verified subject matter experts
Step: 2 Unlock
Step: 3 Unlock