

Question: SAMPLE RANGE (in) 0.011 86.11 Twelve samples, each containing five parts, were taken for a process that produces steel rods at Emmanuel Kodri's factory. The
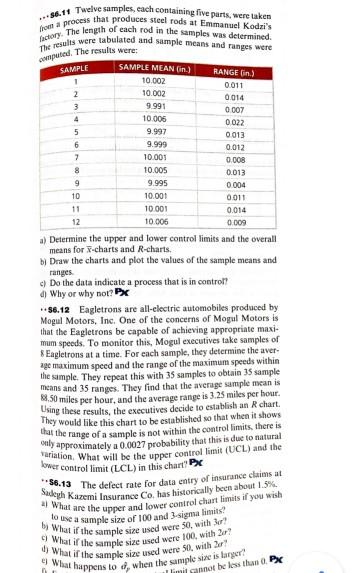
SAMPLE RANGE (in) 0.011 86.11 Twelve samples, each containing five parts, were taken for a process that produces steel rods at Emmanuel Kodri's factory. The length of each rod in the samples was determined The results were tabulated and sample means and ranges were puted. The results were variation What will be the upper controllimit (UCL) and the lower controllimit (LCL) in this chanx $6.13 The defect rate for data entry of insurance claims at Sadegh Kazemi Insurance Co has historically been about 1.5% What are the upper and lower control chart imals if you wish to use a sumple size of 100 and 3-sigma is? by What if the sample size used were 30, with cl Wat if the simple size used were 100, with 20 4) What is the sample size used were 50, with or What happens to , when the simple sue is larger! SAMPLE MEAN (in.) 10.002 2 10.003 0.014 3 9991 0 007 4 10.006 0022 5 9.997 0.013 6 9.999 0.012 7 10.001 0.008 8 10.005 0.013 9 9.995 0.004 10 10.000 0.011 11 10.001 0.014 12 10.006 0.009 a) Determine the upper and lower control limits and the overall means for X-charts and R-charts. b) Draw the charts and plot the values of the sample means and ranges Do the data indicate a process that is in control d) Why or why not? PX $6.12 Eagletrons are all-electric automobiles produced by Mogul Motors, Inc. One of the concerns of Mogul Motors is that the Eagletrons be capable of achieving appropriate maxi. mum speeds. To monitor this, Mogul executives take samples of Eagletrons at a time. For each sample, they determine the aver- age maximum speed and the range of the maximum speeds within the simple. They repeat this with 35 samples to obtain 35 sample means and 35 ranges. They find that the average sample mean is 2.0 miles per hour, and the average range is 3.25 miles per hour. Using these results, the executives decide to establish an chart. They would like this chart to be established so that when it shows that the range of a sample is not within the control limits, there is tly approximately a 0.0027 probability that this is due to natural I limilainnot be less than a PX
Step by Step Solution
There are 3 Steps involved in it
1 Expert Approved Answer
Step: 1 Unlock

Question Has Been Solved by an Expert!
Get step-by-step solutions from verified subject matter experts
Step: 2 Unlock
Step: 3 Unlock