

Question: See Table 2.5 E showing financial statement data and stock price data for Mydeco Corp. a. From 2015 to 2019, what was the total cash
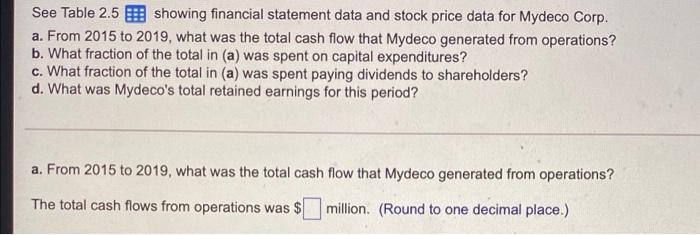
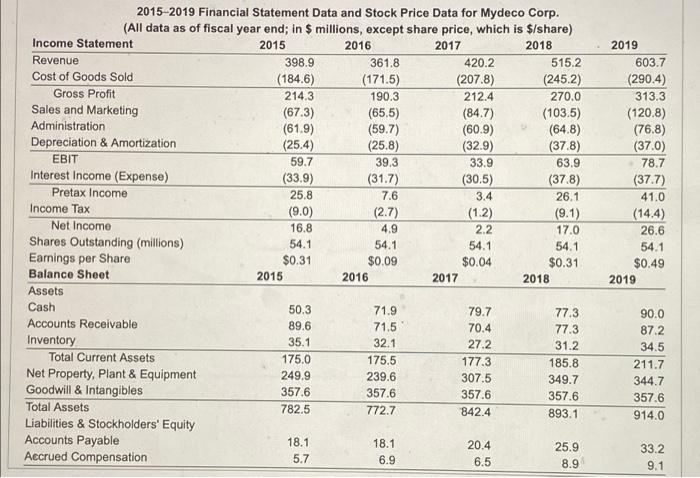
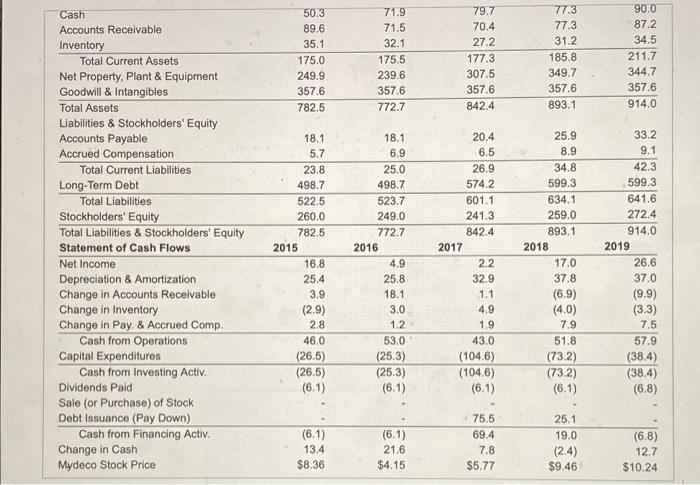
See Table 2.5 E showing financial statement data and stock price data for Mydeco Corp. a. From 2015 to 2019, what was the total cash flow that Mydeco generated from operations? b. What fraction of the total in (a) was spent on capital expenditures? c. What fraction of the total in (a) was spent paying dividends to shareholders? d. What was Mydeco's total retained earnings for this period? a. From 2015 to 2019, what was the total cash flow that Mydeco generated from operations? The total cash flows from operations was $ million. (Round to one decimal place.) 2015-2019 Financial Statement Data and Stock Price Data for Mydeco Corp. (All data as of fiscal year end; in $ millions, except share price, which is $/share) Income Statement 2015 2016 2017 2018 Revenue 398.9 361.8 420.2 515.2 Cost of Goods Sold (184.6) (171.5) (207.8) (245.2) Gross Profit 214.3 190.3 212.4 270.0 Sales and Marketing (67.3) (65.5) (84.7) (103.5) Administration (61.9) (59.7) (60.9) (64.8) Depreciation & Amortization (25.4) (25.8) (32.9) (37.8) EBIT 59.7 39.3 33.9 63.9 Interest Income (Expense) (33.9) (31.7) (30.5) (37.8) Pretax Income 25.8 7.6 26.1 Income Tax (9.0) (2.7) (1.2) (9.1) Net Income 16.8 4.9 2.2 17.0 Shares Outstanding (millions) 54.1 54.1 54.1 54.1 Earnings per Share $0.31 $0.09 $0.04 $0.31 Balance Sheet 2015 2016 2017 2018 Assets Cash 50.3 71.9 79.7 77.3 Accounts Receivable 89.6 71.5 70.4 77.3 Inventory 35.1 32.1 27.2 31.2 Total Current Assets 175.0 175.5 177.3 185.8 Net Property, Plant & Equipment 249.9 239.6 307.5 349.7 Goodwill & Intangibles 357.6 357.6 357.6 357.6 Total Assets 782,5 772.7 842.4 893.1 Liabilities & Stockholders' Equity Accounts Payable 18.1 18.1 20.4 25.9 Accrued Compensation 5.7 6.9 6.5 8.9 2019 603.7 (290.4) 313.3 (120.8) (76.8) (37.0) 78.7 (377) 41.0 (14.4) 26.6 54.1 $0.49 2019 3.4 90.0 87.2 34.5 211.7 344.7 357.6 914.0 33.2 9.1 50.3 89.6 35.1 175.0 249.9 357.6 782.5 71.9 71.5 32.1 175.5 239.6 357.6 772.7 79.7 70.4 27.2 177.3 307.5 357.6 842.4 77.3 77.3 31.2 185.8 349.7 357.6 893.1 90.0 87.2 34.5 211.7 344.7 357.6 914.0 Cash Accounts Receivable Inventory Total Current Assets Net Property, Plant & Equipment Goodwill & Intangibles Total Assets Liabilities & Stockholders' Equity Accounts Payable Accrued Compensation Total Current Liabilities Long-Term Debt Total Liabilities Stockholders' Equity Total Liabilities & Stockholders' Equity Statement of Cash Flows Net Income Depreciation & Amortization Change in Accounts Receivable Change in Inventory Change in Pay & Accrued Comp. Cash from Operations Capital Expenditures Cash from Investing Activ. Dividends Paid Sale (or Purchase) of Stock Debt Issuance (Pay Down) Cash from Financing Activ. Change in Cash Mydeco Stock Price 18.1 5.7 23.8 498.7 522.5 260.0 782.5 2015 16.8 25.4 3.9 (2.9) 2.8 46.0 (26.5) (26.5) (6.1) 18.1 6.9 25.0 498.7 523.7 249.0 772.7 2016 4.9 25.8 18.1 3.0 1.2 53.0 (25.3) (25.3) (6.1) 20.4 6.5 26.9 574.2 601.1 241.3 842.4 2017 2.2 32.9 1.1 4.9 1.9 43.0 (1046) (104.6) (6.1) 25.9 8.9 34.8 599.3 634.1 259.0 893.1 2018 17.0 37.8 (6.9) (4.0) 7.9 51.8 (73.2) (73.2) (6.1) 33.2 9.1 42.3 599.3 641.6 272.4 914.0 2019 26.6 37.0 (9.9) (3.3) 7.5 57.9 (38.4) (38.4) (6.8) (6.1) 13.4 $8.36 (6.1) 21.6 $4.15 75.5 69.4 7.8 $5.77 25.1 19.0 (2.4) $9.46 (6.8) 12.7 $10.24
Step by Step Solution
There are 3 Steps involved in it

Get step-by-step solutions from verified subject matter experts