

Question: Selected comparative statement data for Queen Products Company are presented below. All balance sheet data are as of December 31. Net sales Cost of goods
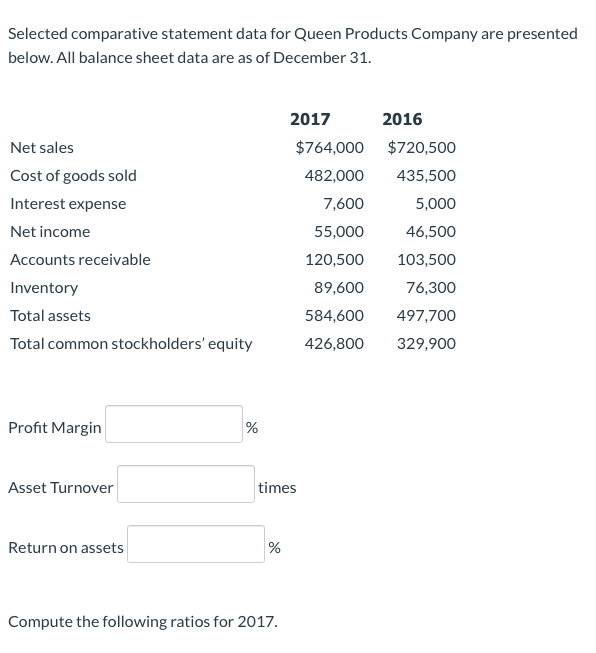
Selected comparative statement data for Queen Products Company are presented below. All balance sheet data are as of December 31. Net sales Cost of goods sold Interest expense Net income Accounts receivable Inventory Total assets Total common stockholders' equity 2017 2016 $764,000 $720,500 482,000 435,500 7,600 5,000 55,000 46,500 120,500 103,500 89,600 76,300 584,600 497,700 426,800 329,900 Profit Margin % Asset Turnover times Return on assets % Compute the following ratios for 2017
Step by Step Solution
There are 3 Steps involved in it
1 Expert Approved Answer
Step: 1 Unlock

Question Has Been Solved by an Expert!
Get step-by-step solutions from verified subject matter experts
Step: 2 Unlock
Step: 3 Unlock