

Question: Standard Lower Upper Lower Upper Coefficients t Stat P-value Error 95% 95% 95.0% 95.0% Intercept 5.774194 4.265918 1.353564 0.268827 -7.80186 19.35025 -7.80186 19.35025 Break- 4.33871

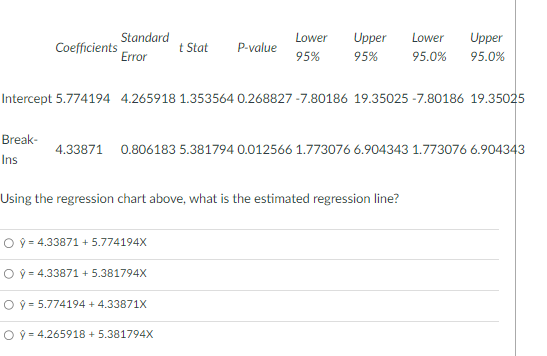
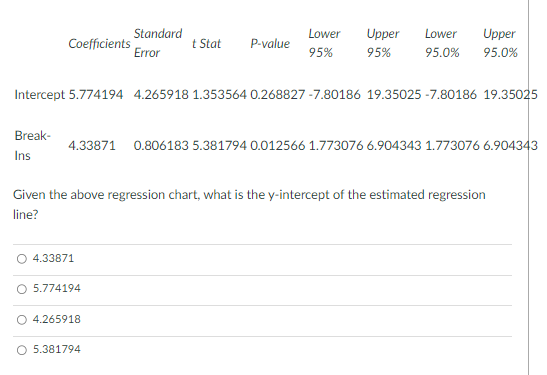

Standard Lower Upper Lower Upper Coefficients t Stat P-value Error 95% 95% 95.0% 95.0% Intercept 5.774194 4.265918 1.353564 0.268827 -7.80186 19.35025 -7.80186 19.35025 Break- 4.33871 0.806183 5.381794 0.012566 1.773076 6.904343 1.773076 6.904343 Ins Given the above regression chart, what is the y-intercept of the estimated regression line? O 4.33871 O 5.774194 O 4.265918 O 5.381794Standard Lower Upper Lower Upper Coefficients t Stat P-value Error 95% 95% 95.0% 95.0% Intercept 5.774194 4.265918 1.353564 0.268827 -7.80186 19.35025-7.80186 19.35025 Break- 4.33871 0.806183 5.381794 0.012566 1.773076 6.904343 1.773076 6.904343 Ins Using the regression chart above, what is the estimated regression line? O y = 4.33871 + 5.774194X O p = 4.33871 + 5.381794X O y = 5.774194 + 4.33871X O ? = 4.265918 + 5.381794X
Step by Step Solution
There are 3 Steps involved in it

Get step-by-step solutions from verified subject matter experts