

Question: Statistics for three assets L, M&N are shown in the following tables: Asset Table Asset L Standard Deviation 30% Return Correlation of Returns Asset -
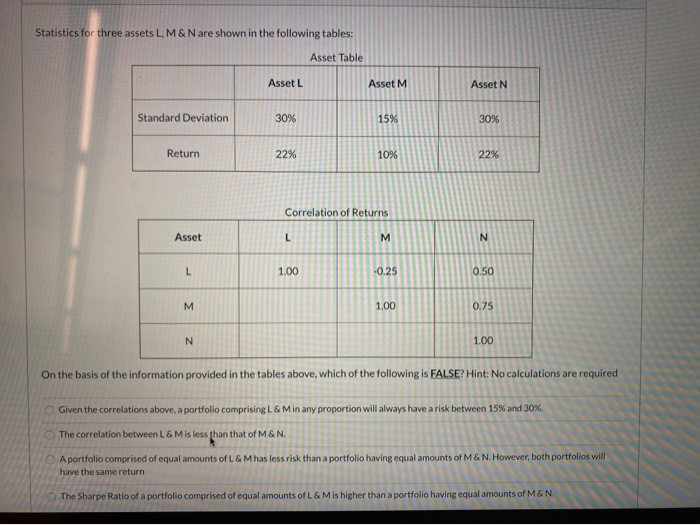
Statistics for three assets L, M&N are shown in the following tables: Asset Table Asset L Standard Deviation 30% Return Correlation of Returns Asset - 3 On the basis of the information provided in the tables above, which of the following is FALSE? Hint: No calculations are required Given the correlations above, a portfolio comprising L&M in any proportion will always have a risk between 15% and 30% The correlation between L&M is less than that of M&N. amounts of M&N. However, both A portfolio comprised of equal amounts of L& Mhas less risk than a portfolio having have the same return The Sharpe Ratio of a portfolio comprised of equal amounts of L&M is higher the portfolio having equal amounts of M&N
Step by Step Solution
There are 3 Steps involved in it

Get step-by-step solutions from verified subject matter experts