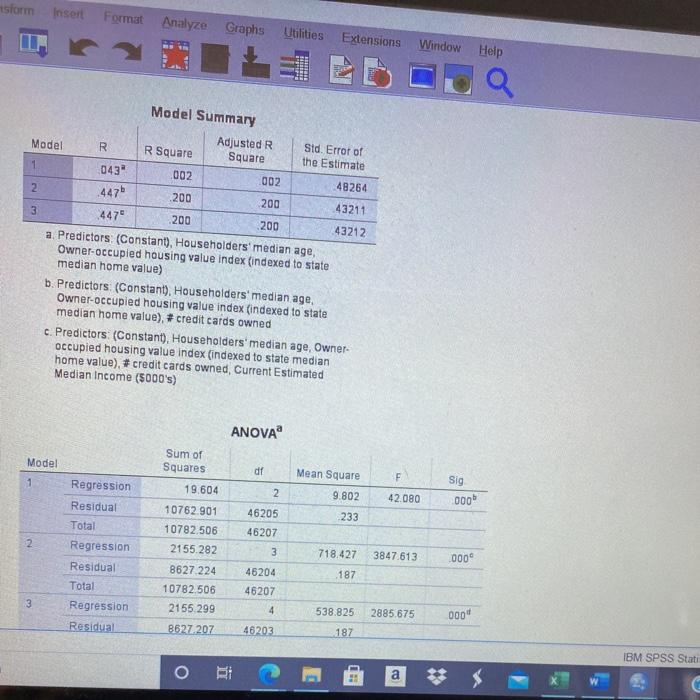
Question: storm insert Format Analyze Graphs Utilities Extensions Window Help Q Model Model Summary Adjusted R R Square Square 002 002 R Std. Error of the
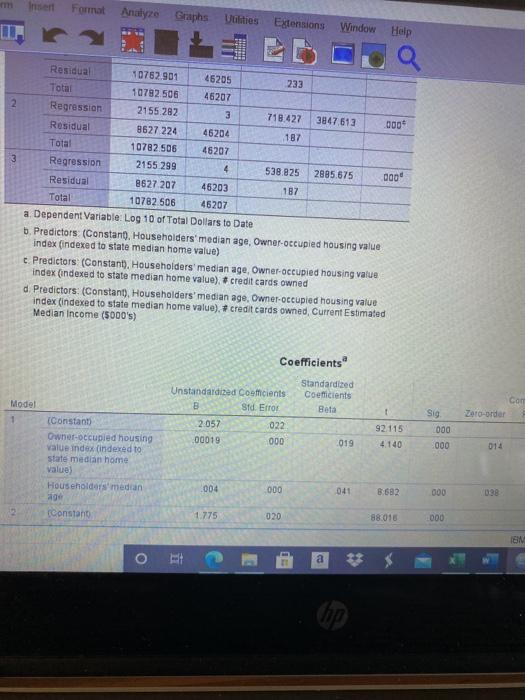
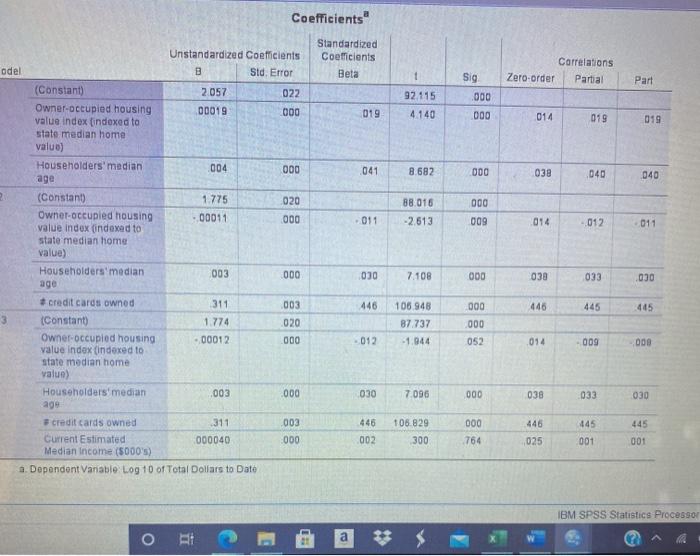
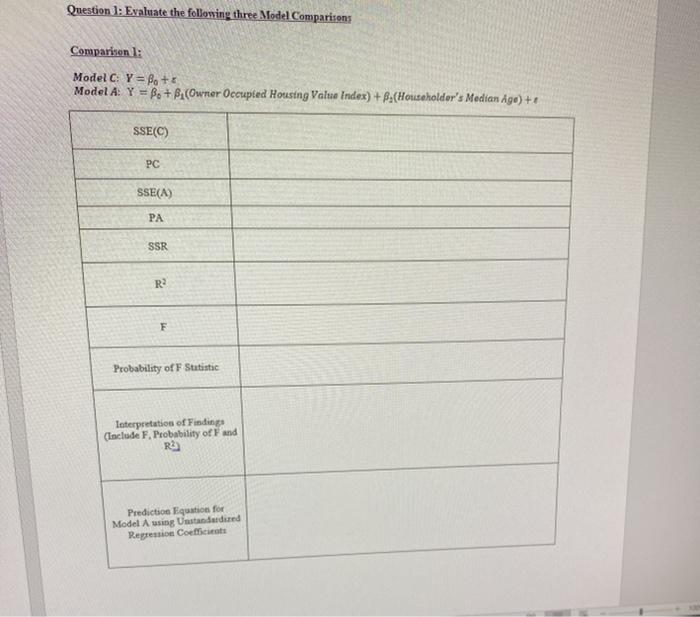
storm insert Format Analyze Graphs Utilities Extensions Window Help Q Model Model Summary Adjusted R R Square Square 002 002 R Std. Error of the Estimate 1 043 4476 48264 200 200 43211 447 200 200 43212 a. Predictors (Constant), Householders' median age, Owner-occupied housing value index (indexed to state median home value) b. Predictors (Constant), Householders' median age Owner-occupied housing value index (indexed to state median home value), # credit cards owned c. Predictors (Constant), Householders' median age, Owner occupied housing value index (indexed to state median home value), # credit cards owned, Current Estimated Median Income (5000's) ANOVA Model Sum of Squares df 1 Mean Square 9.802 19.604 2 Sig 000 42.080 46205 10762.901 10782.506 233 46207 2 Regression Residual Total Regression Residual Total Regression 2155 282 3 718.427 3847.613 .000 187 8627224 10782.506 2155 299 46204 46207 3 4 538.825 2885.675 000" Residual 8627 207 46203 187 a ** $ IBM SPSS Stati G Insert Format Analyze Graphs Utilities Edensions Window Help 2 3 Residual 0762.901 45205 233 Total 10782 506 46207 Regression 2155 282 3 718 427 3847,613 000 Residual 9627 224 46204 187 Total 10782 506 46207 Regression 2155 299 4 538 825 2885 675 000" Residual 8627 207 46203 187 Total 10782 506 45207 a Dependent Variable: Log 10 of Total Dollars to Date b. Predictors (Constan. Householders' median age, Owner-occupied housing value index (indexed to state median home value) Predictors (Constant. Householders' median age, Owner-occupied housing value Index (Indexed to state median home value) # credit cards owned d Predictors: (Constant), Householders' median age. Owner-occupied housing value index (indexed to state median home value) # credit cards owned Current Estimated Median Income (5000's) Coefficients Standardized Coeficients Bota Model Unstandardized Coacients Sid Error 2.057 022 00019 000 Com Zoo-order Sig 000 92 115 4.140 019 000 014 Constant Owner-occupied housing value index indexed to state median home value) Householders median 004 000 041 8.682 000 Constant 1.775 020 88.018 000 BM o a Coefficients Unstandardized Coefficients B Std. Error Standardized Coeficients Beta odel Carrelations Zero-order Partial Sig 000 Part 2.057 022 92.115 00019 000 019 4.140 000 014 019 019 (Constant) Owner-occupied housing value index indexed to state median home value) Householders' median age 004 000 041 8.682 000 038 040 040 000 020 000 88.016 -2613 011 009 014 - 012 011 000 030 7.108 000 038 033 030 003 446 446 445 445 3 (Constant 1.775 Owner-occupied housing - 00011 value index indexed to state median home value) Householders median 003 age credit cards owned 311 (Constant 1.774 Owner-occupied housing 00012 value Index (indexed to state median home value) Householders' median 003 age credit cards owned 311 Current Estimated 000040 Median Income (5000's) a. Dependent Vanable Log 10 of Total Dollars to Date 000 000 106.948 87 737 -1.944 020 2000 - 012 052 014 009 000 000 030 7.096 000 038 033 030 000 446 445 445 003 000 446 002 106.829 300 764 025 001 001 IBM SPSS Statistics Processor o RE Question 1: Evaluate the following three Model Comparisons Comparison 1: Model: Y = Bo + Model A: Y = B. + Bi(Owner Occupied Housing Value Index) + B.(Householder's Median Ago) ++ SSE(C) PC SSE(A) PA SSR R2 F Probability of F Statistic Interpretation of Findings (Include F. Probability of Find R Prediction Equations for Model A using standardized Repression Cost storm insert Format Analyze Graphs Utilities Extensions Window Help Q Model Model Summary Adjusted R R Square Square 002 002 R Std. Error of the Estimate 1 043 4476 48264 200 200 43211 447 200 200 43212 a. Predictors (Constant), Householders' median age, Owner-occupied housing value index (indexed to state median home value) b. Predictors (Constant), Householders' median age Owner-occupied housing value index (indexed to state median home value), # credit cards owned c. Predictors (Constant), Householders' median age, Owner occupied housing value index (indexed to state median home value), # credit cards owned, Current Estimated Median Income (5000's) ANOVA Model Sum of Squares df 1 Mean Square 9.802 19.604 2 Sig 000 42.080 46205 10762.901 10782.506 233 46207 2 Regression Residual Total Regression Residual Total Regression 2155 282 3 718.427 3847.613 .000 187 8627224 10782.506 2155 299 46204 46207 3 4 538.825 2885.675 000" Residual 8627 207 46203 187 a ** $ IBM SPSS Stati G Insert Format Analyze Graphs Utilities Edensions Window Help 2 3 Residual 0762.901 45205 233 Total 10782 506 46207 Regression 2155 282 3 718 427 3847,613 000 Residual 9627 224 46204 187 Total 10782 506 46207 Regression 2155 299 4 538 825 2885 675 000" Residual 8627 207 46203 187 Total 10782 506 45207 a Dependent Variable: Log 10 of Total Dollars to Date b. Predictors (Constan. Householders' median age, Owner-occupied housing value index (indexed to state median home value) Predictors (Constant. Householders' median age, Owner-occupied housing value Index (Indexed to state median home value) # credit cards owned d Predictors: (Constant), Householders' median age. Owner-occupied housing value index (indexed to state median home value) # credit cards owned Current Estimated Median Income (5000's) Coefficients Standardized Coeficients Bota Model Unstandardized Coacients Sid Error 2.057 022 00019 000 Com Zoo-order Sig 000 92 115 4.140 019 000 014 Constant Owner-occupied housing value index indexed to state median home value) Householders median 004 000 041 8.682 000 Constant 1.775 020 88.018 000 BM o a Coefficients Unstandardized Coefficients B Std. Error Standardized Coeficients Beta odel Carrelations Zero-order Partial Sig 000 Part 2.057 022 92.115 00019 000 019 4.140 000 014 019 019 (Constant) Owner-occupied housing value index indexed to state median home value) Householders' median age 004 000 041 8.682 000 038 040 040 000 020 000 88.016 -2613 011 009 014 - 012 011 000 030 7.108 000 038 033 030 003 446 446 445 445 3 (Constant 1.775 Owner-occupied housing - 00011 value index indexed to state median home value) Householders median 003 age credit cards owned 311 (Constant 1.774 Owner-occupied housing 00012 value Index (indexed to state median home value) Householders' median 003 age credit cards owned 311 Current Estimated 000040 Median Income (5000's) a. Dependent Vanable Log 10 of Total Dollars to Date 000 000 106.948 87 737 -1.944 020 2000 - 012 052 014 009 000 000 030 7.096 000 038 033 030 000 446 445 445 003 000 446 002 106.829 300 764 025 001 001 IBM SPSS Statistics Processor o RE Question 1: Evaluate the following three Model Comparisons Comparison 1: Model: Y = Bo + Model A: Y = B. + Bi(Owner Occupied Housing Value Index) + B.(Householder's Median Ago) ++ SSE(C) PC SSE(A) PA SSR R2 F Probability of F Statistic Interpretation of Findings (Include F. Probability of Find R Prediction Equations for Model A using standardized Repression Cost