

Question: SUBJECT : OPERATION MANAGEMENT PLEASE USE MANUAL CALCULATION (HANDWRITING OR WORD). I really appreciate your help in resolving the problem in advance. Abron Store sells
SUBJECT : OPERATION MANAGEMENT
PLEASE USE MANUAL CALCULATION (HANDWRITING OR WORD).
I really appreciate your help in resolving the problem in advance.
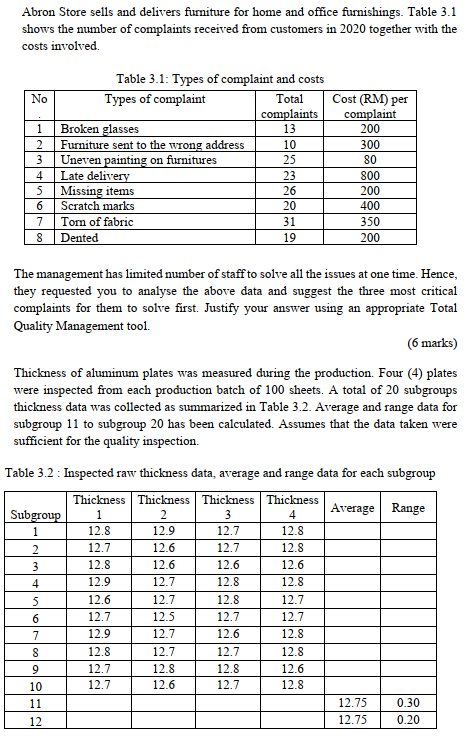
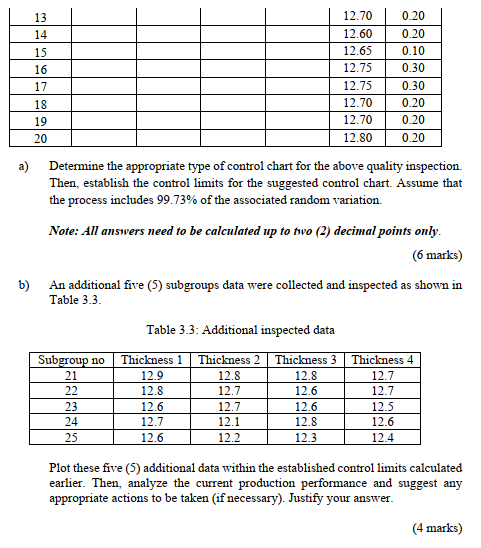
Abron Store sells and delivers furniture for home and office furnishings. Table 3.1 shows the number of complaints received from customers in 2020 together with the costs involved No 1 2 3 4 5 6 7 8 Table 3.1: Types of complaint and costs Types of complaint Total Cost (RM) per complaints complaint Broken glasses 13 200 Furniture sent to the wrong address 10 300 Uneven painting on furnitures 25 80 Late delivery 23 800 Missing items 26 200 Scratch marks 20 400 Torn of fabric 31 350 Dented 19 200 The management has limited number of staff to solve all the issues at one time. Hence, they requested you to analyse the above data and suggest the three most critical complaints for them to solve first. Justify your answer using an appropriate Total Quality Management tool. (6 marks) Thickness of aluminum plates was measured during the production. Four (4) plates were inspected from each production batch of 100 sheets. A total of 20 subgroups thickness data was collected as summarized in Table 3.2. Average and range data for subgroup 11 to subgroup 20 has been calculated. Assumes that the data taken were sufficient for the quality inspection Table 3.2 : Inspected raw thickness data, average and range data for each subgroup Thickness Thickness Thickness Thickness Subgroup 2 3 4 Average Range 1 12.8 12.9 12.7 12.8 2 12.7 12.6 12.7 12.8 3 12.8 12.6 12.6 12.6 4 12.9 12.7 12.8 12.8 5 12.6 12.7 12.8 12.7 6 12.7 12.5 12.7 12.7 7 12.9 12.7 12.6 12.8 8 12.8 12.7 12.7 12.8 9 12.7 12.8 12.8 12.6 10 12.7 12.6 12.7 12.8 11 12.75 0.30 12 12.75 0.20 1 13 14 15 16 17 18 19 20 12.70 12.60 12.65 12.75 12.75 12.70 12.70 12.80 0.20 0.20 0.10 0.30 0.30 0.20 0.20 0.20 a) Determine the appropriate type of control chart for the above quality inspection. Then, establish the control limits for the suggested control chart. Assume that the process includes 99.73% of the associated random variation. b) Note: All answers need to be calculated up to two (2) decimal points only. (6 marks) An additional five (5) subgroups data were collected and inspected as shown in Table 3.3. Table 3.3. Additional inspected data Subgroup no 21 22 23 24 Thickness 1 12.9 12.8 12.6 12.7 12.6 Thickness 2 12.8 12.7 12.7 12.1 12.1 Thickness 3 12.8 12.6 12.6 12.8 12.3 Thickness 4 12.7 12.7 12.5 12.6 12.4 Plot these five (5) additional data within the established control limits calculated earlier. Then, analyze the current production performance and suggest any appropriate actions to be taken (if necessary). Justify your answer. (4 marks)Step by Step Solution
There are 3 Steps involved in it
1 Expert Approved Answer
Step: 1 Unlock

Question Has Been Solved by an Expert!
Get step-by-step solutions from verified subject matter experts
Step: 2 Unlock
Step: 3 Unlock