

Question: Suppose the returns and corresponding beta values for two assets (A and B) were as indicated on the following graph: Sample mean return .15
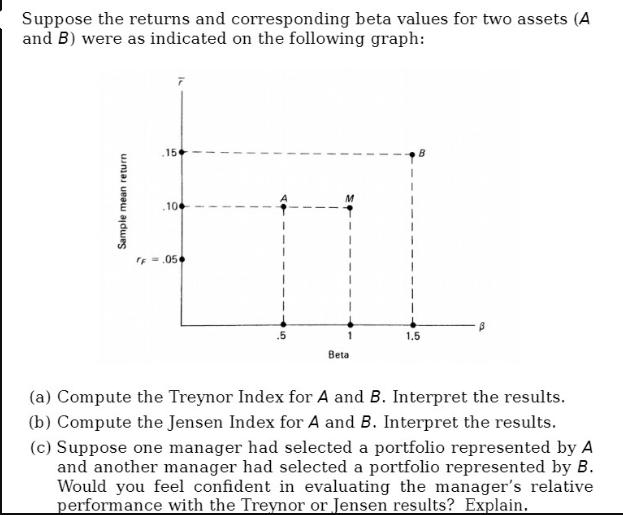
Suppose the returns and corresponding beta values for two assets (A and B) were as indicated on the following graph: Sample mean return .15 10 FF=.05 Beta 1.5 (a) Compute the Treynor Index for A and B. Interpret the results. (b) Compute the Jensen Index for A and B. Interpret the results. (c) Suppose one manager had selected a portfolio represented by A and another manager had selected a portfolio represented by B. Would you feel confident in evaluating the manager's relative performance with the Treynor or Jensen results? Explain.
Step by Step Solution
★★★★★
3.46 Rating (143 Votes )
There are 3 Steps involved in it
1 Expert Approved Answer
Step: 1 Unlock

Question Has Been Solved by an Expert!
Get step-by-step solutions from verified subject matter experts
Step: 2 Unlock
Step: 3 Unlock