Answered step by step
Verified Expert Solution
Question
1 Approved Answer
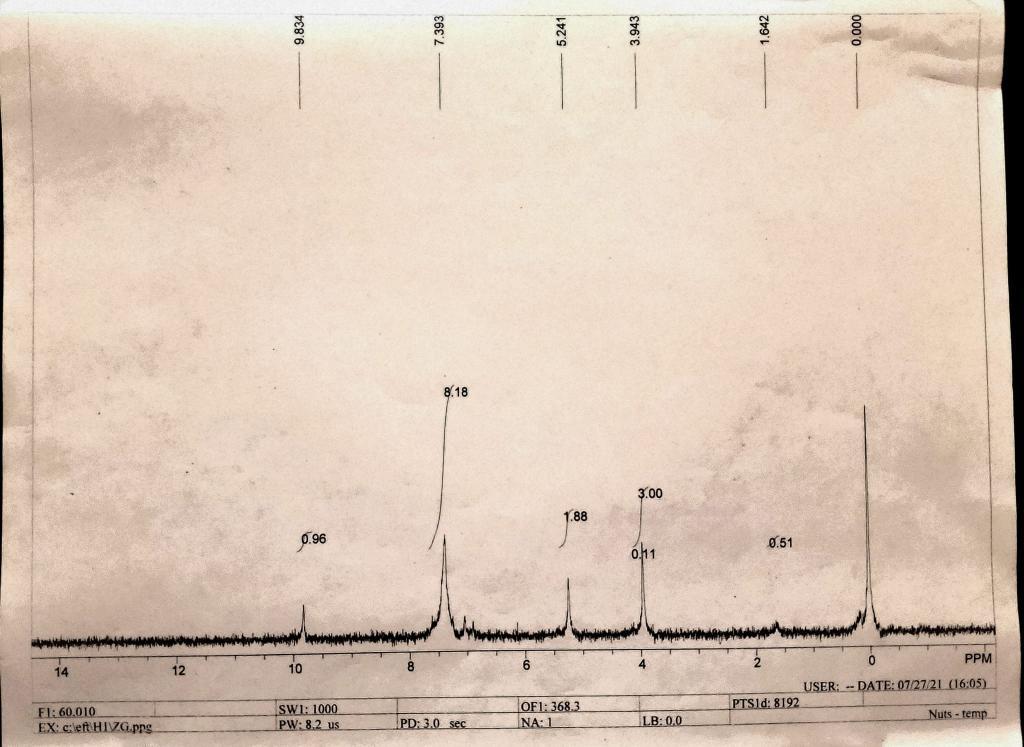
b. What is the experimental integration ratio in the H-NMR data that you obtained? Is this ratio consistent with the expected integration ratio of the
b. What is the experimental integration ratio in the H-NMR data that you obtained? Is this ratio consistent with the expected integration ratio of the pure product?
c. According to the H-NMR data, is the sample you prepared pure?
d. Label the peak in the H-NMR spectrum a, b, c etc. starting with the most uplift peak. Draw the structure of 4-BENZOXY-3-METHOXYBENZALDEHYDE and label each proton a, b, c etc. accordingly. According the multiplicity for all of the non-equivalent protons

8.18 3.00 1.88 p.96 0.51 PPM 14 12 10 USER: -- DATE: 07/27/21 (16:05) OF1: 368.3 NA: 1 PTS1:: 8192 FI: 60.010 EX: c:left HIVGppg SWI: 1000 PW: 8.2 us PD: 3.0 sec LB: 0.0 Nuts - temp 9.834 E6E'L 5.241 3.943 1.642
Step by Step Solution
★★★★★
3.50 Rating (170 Votes )
There are 3 Steps involved in it
Step: 1
b What is the experimental integration ratio in the HNMR data that you obtained There a...
Get Instant Access to Expert-Tailored Solutions
See step-by-step solutions with expert insights and AI powered tools for academic success
Step: 2

Step: 3

Document Format ( 2 attachments)
636ae4b0af723_240413.pdf
180 KBs PDF File
636ae4b0af723_240413.docx
120 KBs Word File
Ace Your Homework with AI
Get the answers you need in no time with our AI-driven, step-by-step assistance
Get Started


