

Question: TABLE A - 5 - The Transition Probability Matrix for Chern's ( Based on the Last 3 Years ) table [ [ table
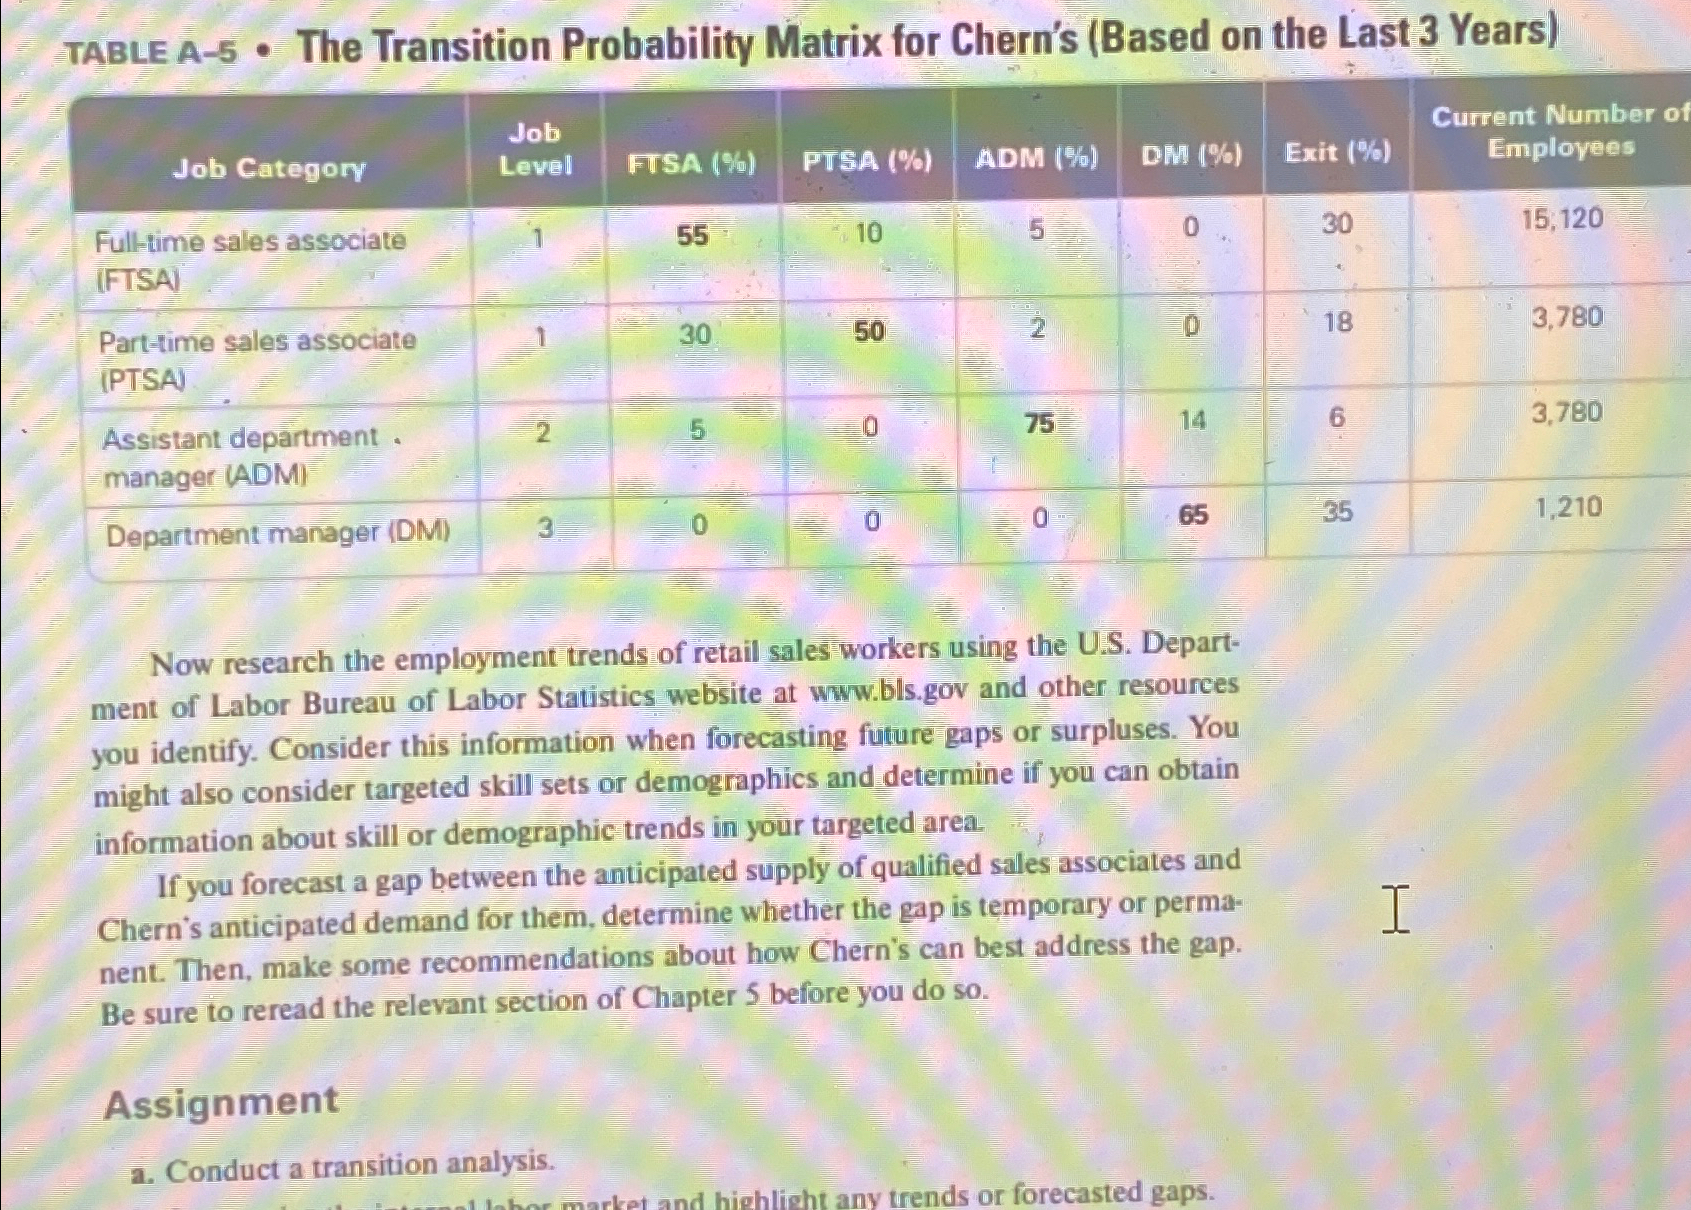
TABLE A The Transition Probability Matrix for Chern's Based on the Last Years
tabletableJob CategoryLevelFISA PTSA ADM DM Exit tableCurrent Number ofEmployeestableFulttime sales associateFTSAtableParttime sales associatePTSAtableAssistant departmentmanager ADMDepartment manager DM
Now research the employment trends of retail sales workers using the US Department of Labor Bureau of Labor Statistics website at
wwwblsgov and other resources you identify. Consider this information when forecasting future gaps or surpluses. You might also consider targeted skill sets or demographics and determine if you can obtain information about skill or demographic trends in your targeted area.
If you forecast a gap between the anticipated supply of qualified sales associates and Chern's anticipated demand for them, determine whether the gap is temporary or permanent. Then, make some recommendations about how Chern's can best address the gap. Be sure to reread the relevant section of Chapter before you do so
Assignment
a Conduct a transition analysis.
Step by Step Solution
There are 3 Steps involved in it
1 Expert Approved Answer
Step: 1 Unlock

Question Has Been Solved by an Expert!
Get step-by-step solutions from verified subject matter experts
Step: 2 Unlock
Step: 3 Unlock