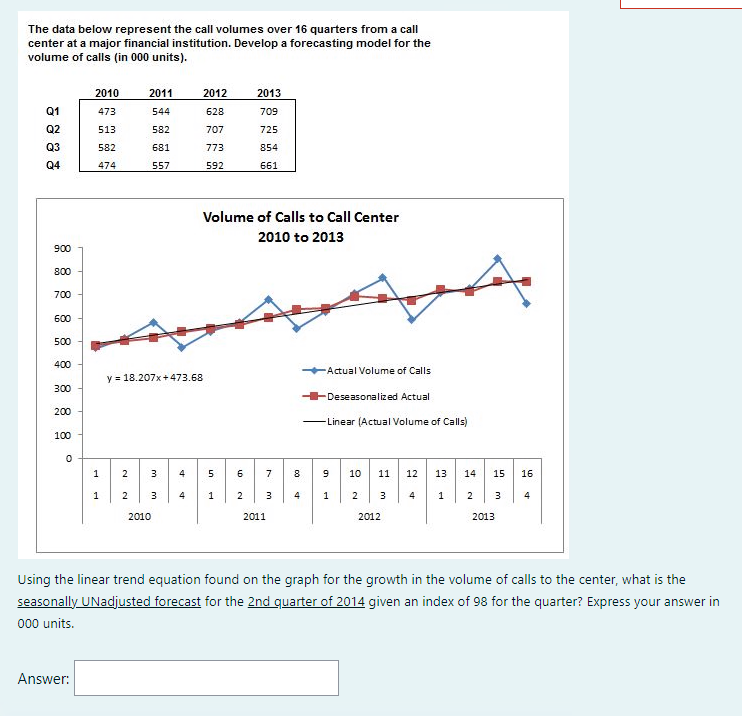
Question: The data below represent the call volumes over 16 quarters from a call center at a major financial institution. Develop a forecasting model for the

The data below represent the call volumes over 16

The data below represent the call volumes over 16 quarters from a call center at a major financial institution. Develop a forecasting model for the volume of calls (in 000 units). 2011 2010 473 2012 628 2013 709 Q1 544 582 707 725 Q2 Q3 Q4 513 582 681 773 854 474 557 592 661 Volume of Calls to Call Center 2010 to 2013 900 800 700 600 500 400 Actual Volume of Calls y = 18.207x+473.68 300 Deseasonalized Actual 200 -Linear (Actual Volume of Calls) 100 0 1 2 3 4 5 6 7 9 10 11 12 13 14 15 16 8 4 1 1 2 3 4 1 2 3 1 2 3 4 1 2 3 4 2010 2011 2012 2013 Using the linear trend equation found on the graph for the growth in the volume of calls to the center, what is the seasonally UNadjusted forecast for the 2nd quarter of 2014 given an index of 98 for the quarter? Express your answer in 000 units

Step by Step Solution

There are 3 Steps involved in it

1 Expert Approved Answer
Step: 1 Unlock blur-text-image
Question Has Been Solved by an Expert!

Get step-by-step solutions from verified subject matter experts

Step: 2 Unlock
Step: 3 Unlock

Students Have Also Explored These Related General Management Questions!