

Question: The data points in the table below relate the number of textbooks sold (S) to the price per textbook (P). Note that in the
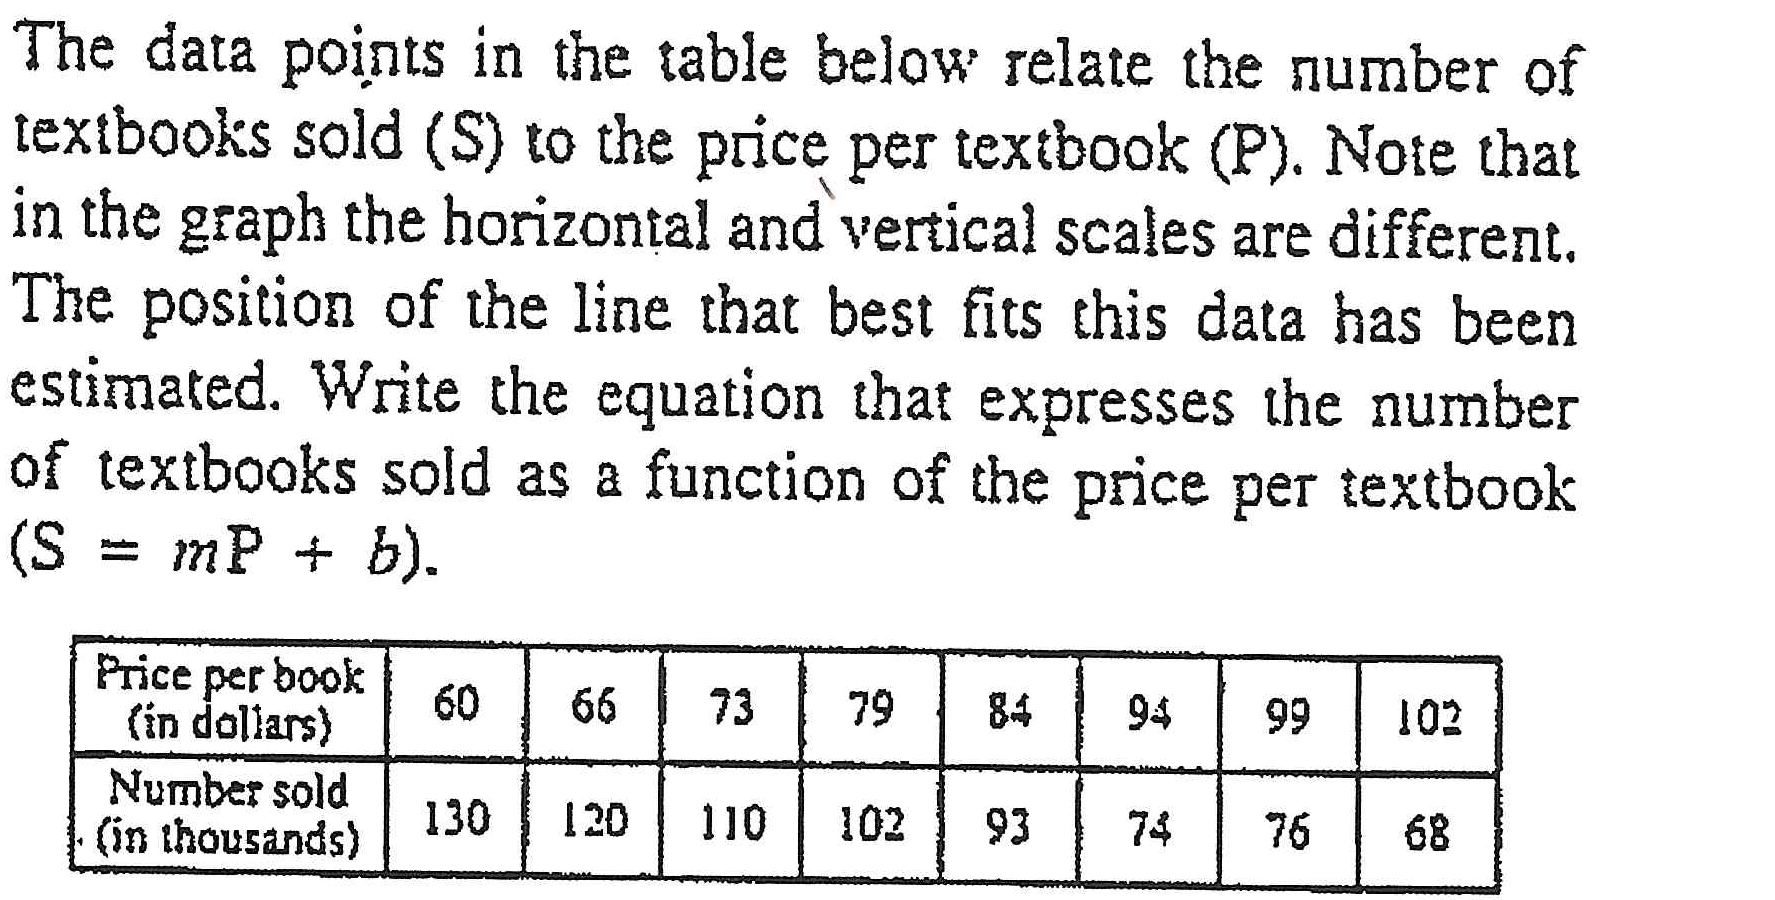
The data points in the table below relate the number of textbooks sold (S) to the price per textbook (P). Note that in the graph the horizontal and vertical scales are different. The position of the line that best fits this data has been estimated. Write the equation that expresses the number of textbooks sold as a function of the price per textbook (S = mP + b). Price per book 60 66 (in dollars) 73 79 84 94 99 102 Number sold (in thousands) 130 120 110 102 93 74 76 68 |
Step by Step Solution
There are 3 Steps involved in it
1 Expert Approved Answer
Step: 1 Unlock

Question Has Been Solved by an Expert!
Get step-by-step solutions from verified subject matter experts
Step: 2 Unlock
Step: 3 Unlock