

Question: The data shown in Table 1 are x and R values for 15 samples. Set up x and R charts on this process. Does
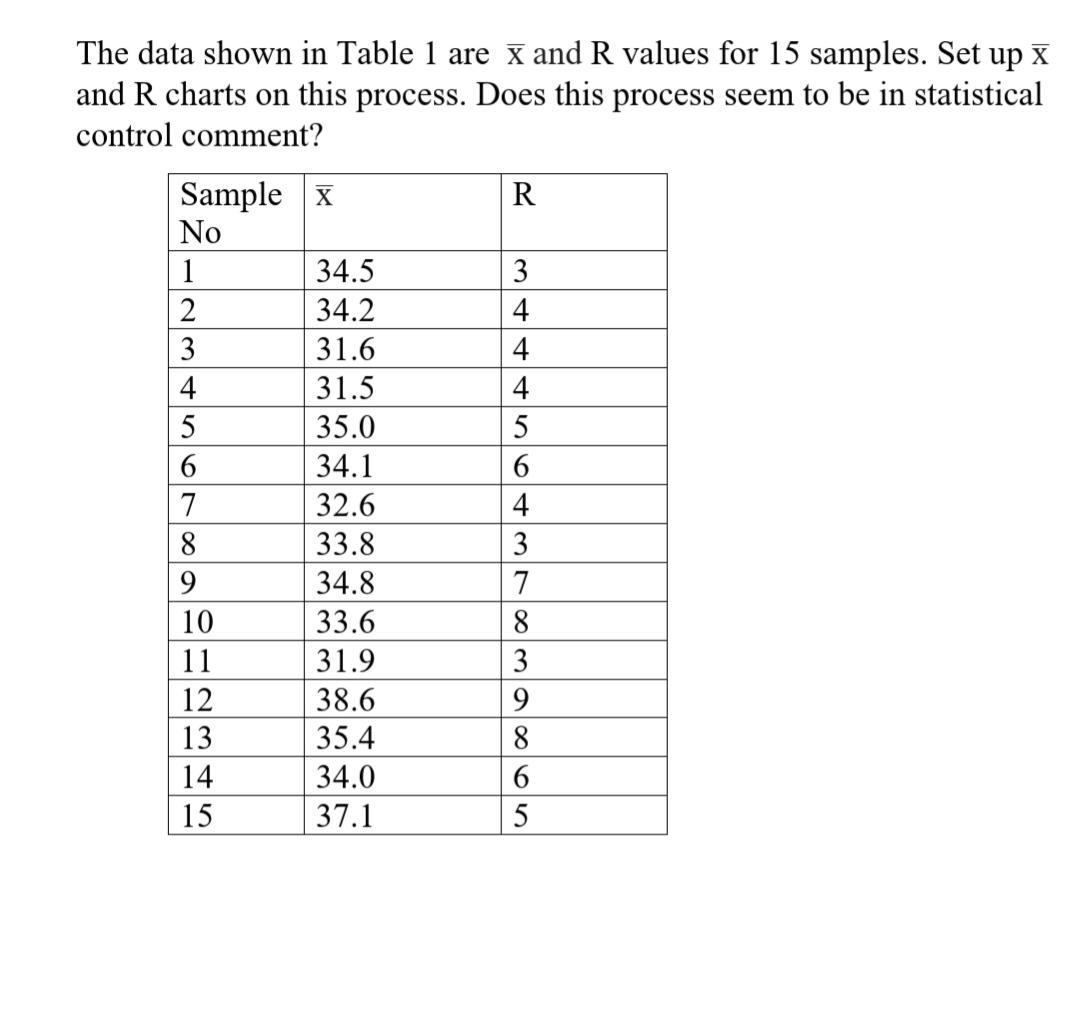
The data shown in Table 1 are x and R values for 15 samples. Set up x and R charts on this process. Does this process seem to be in statistical control comment? Sample x No R 1 34.5 3 34.2 4 3 31.6 4 4 31.5 4 5 35.0 5 6. 34.1 7 32.6 4 8. 33.8 3 9. 34.8 7 10 33.6 8. 11 31.9 3 12 38.6 9. 13 35.4 8 14 34.0 15 37.1 5
Step by Step Solution
There are 3 Steps involved in it
1 Expert Approved Answer
Step: 1 Unlock

Question Has Been Solved by an Expert!
Get step-by-step solutions from verified subject matter experts
Step: 2 Unlock
Step: 3 Unlock