

Question: The figure shows how a function f ( x ) and its linear approximation ( i . e . , its tangent line ) change
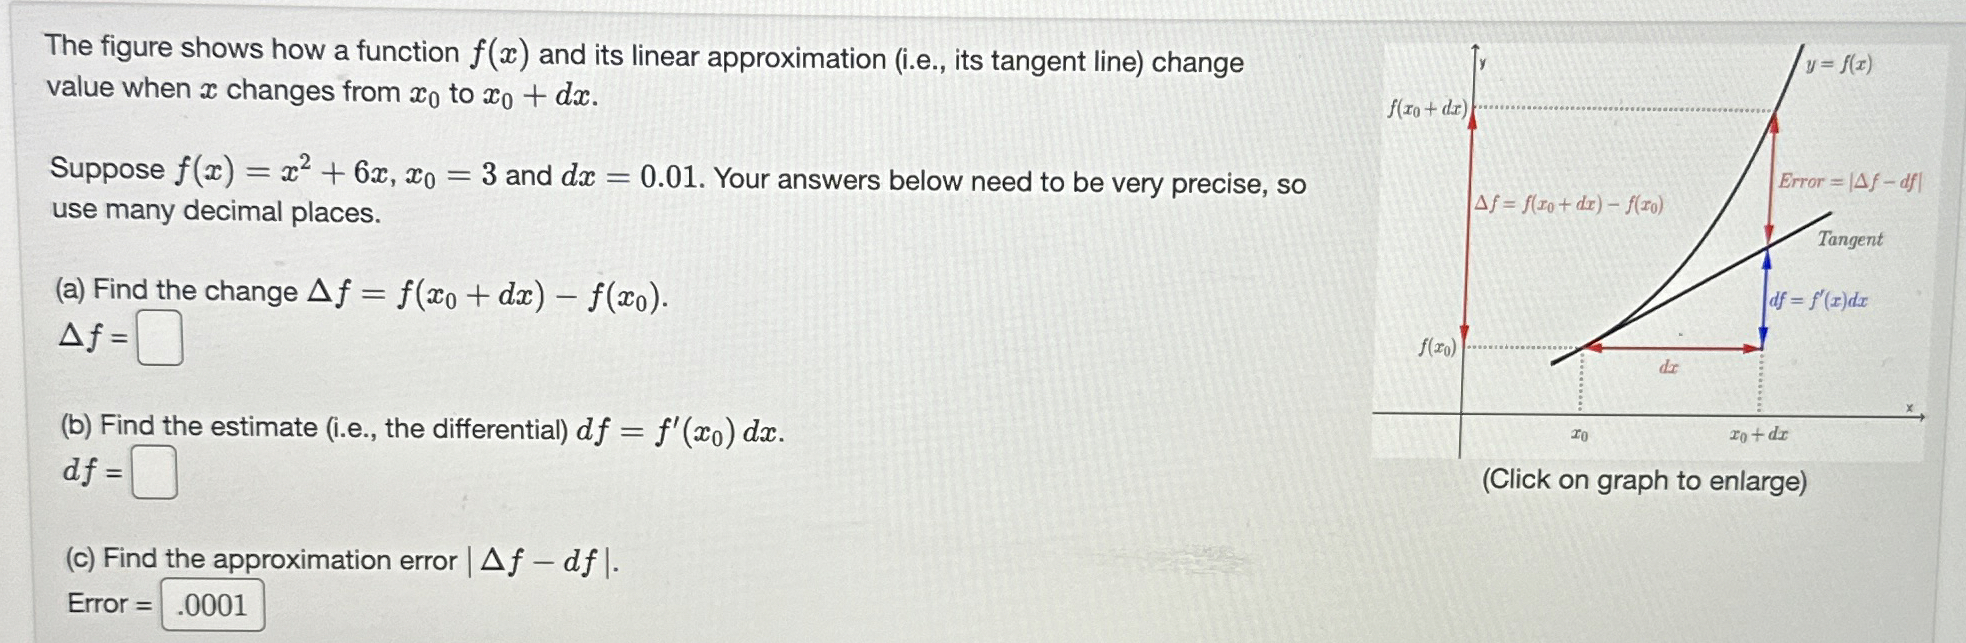
The figure shows how a function and its linear approximation ie its tangent line change value when changes from to
Suppose and Your answers below need to be very precise, so use many decimal places.
a Find the change
b Find the estimate ie the differential
c Find the approximation error
Error
Step by Step Solution
There are 3 Steps involved in it
1 Expert Approved Answer
Step: 1 Unlock

Question Has Been Solved by an Expert!
Get step-by-step solutions from verified subject matter experts
Step: 2 Unlock
Step: 3 Unlock