

Question: The following information is given below about a project. table [ [ Activity , Optimistic Time ( weeks ) , table [ [
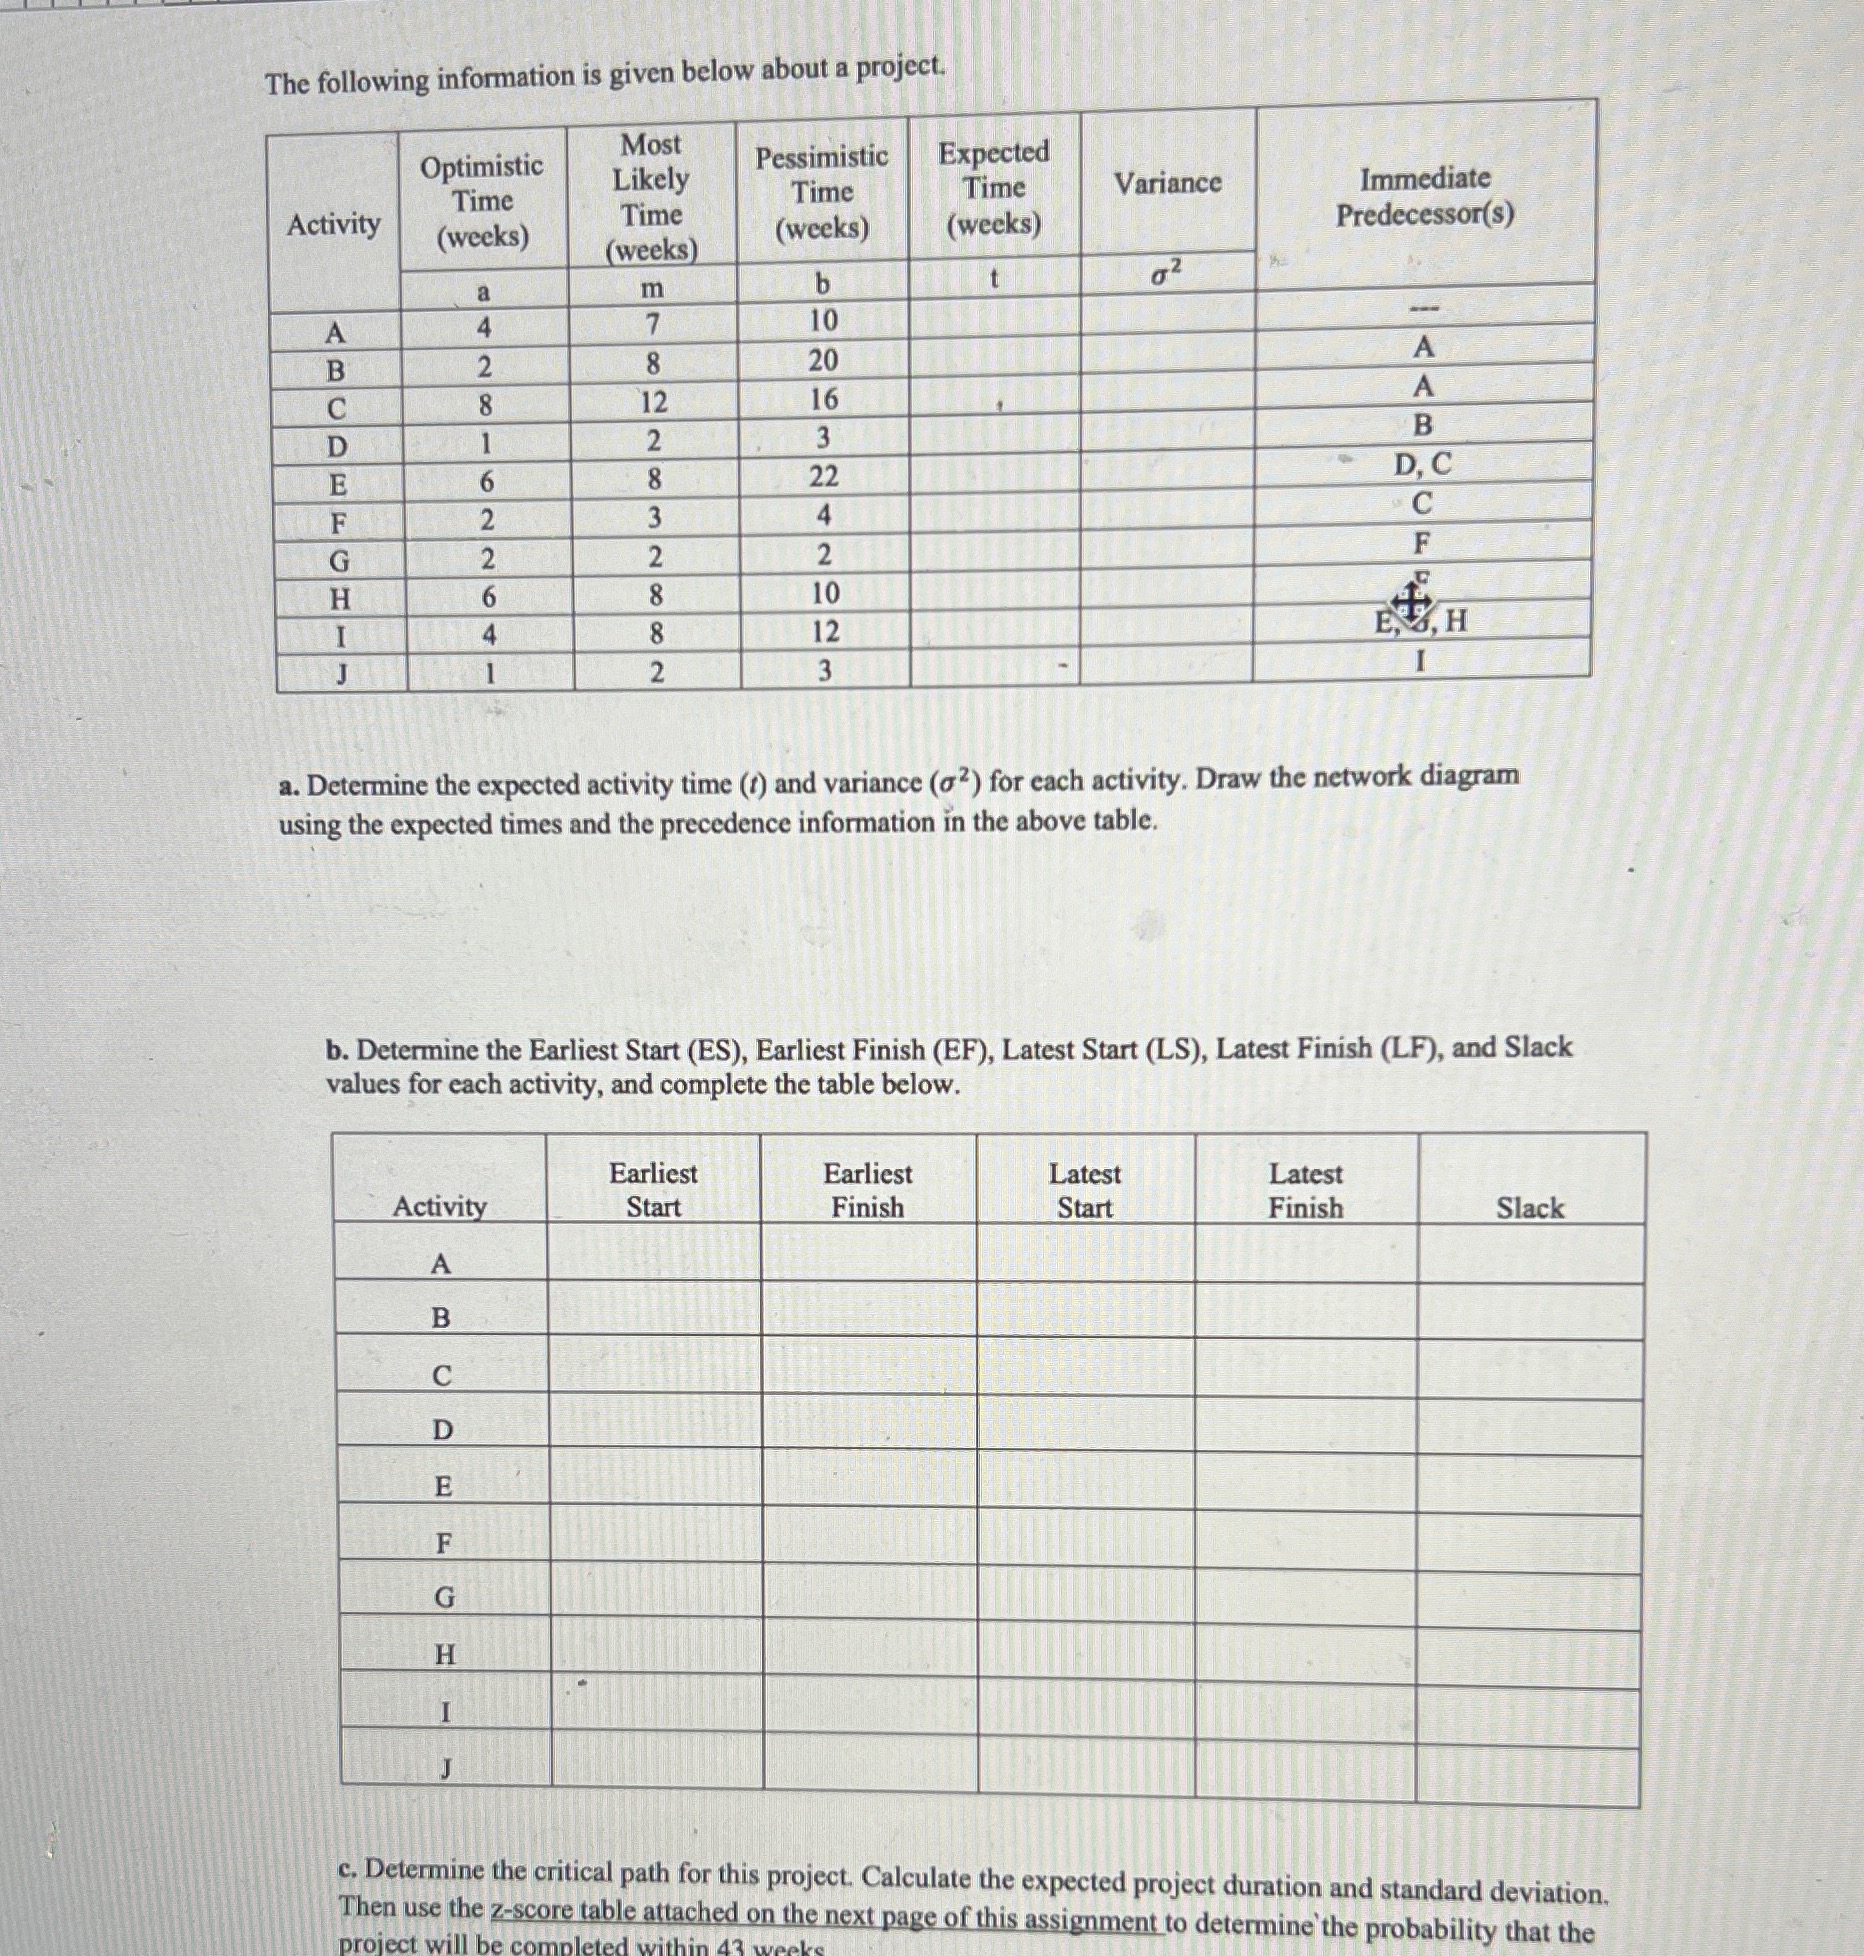
The following information is given below about a project.
tableActivityOptimistic Time weekstableMostLikelyTimeweeksPessimistic Time weeksExpected Time weeksVariance,tableImmediatePredecessorsambtAABACADBE D CFCGFHIE HJI
a Determine the expected activity time and variance for each activity. Draw the network diagram using the expected times and the precedence information in the above table.
b Determine the Earliest Start ES Earliest Finish EF Latest Start LS Latest Finish LF and Slack values for each activity, and complete the table below.
tableActivitytableEarliestStarttableEarliestFinishtableLatestStarttableLatestFinishSlackABCDEFGHIJ
c Determine the critical path for this project. Calculate the expected project duration and standard deviation. Then use the zscore table attached on the next page of this assignment to determine the probability that the
Step by Step Solution
There are 3 Steps involved in it
1 Expert Approved Answer
Step: 1 Unlock

Question Has Been Solved by an Expert!
Get step-by-step solutions from verified subject matter experts
Step: 2 Unlock
Step: 3 Unlock