

Question: The graph below shows the function y - f(x) and the function y = 9(I) . 10 -9 -8 -7 -6 -5 -4 -3 -2

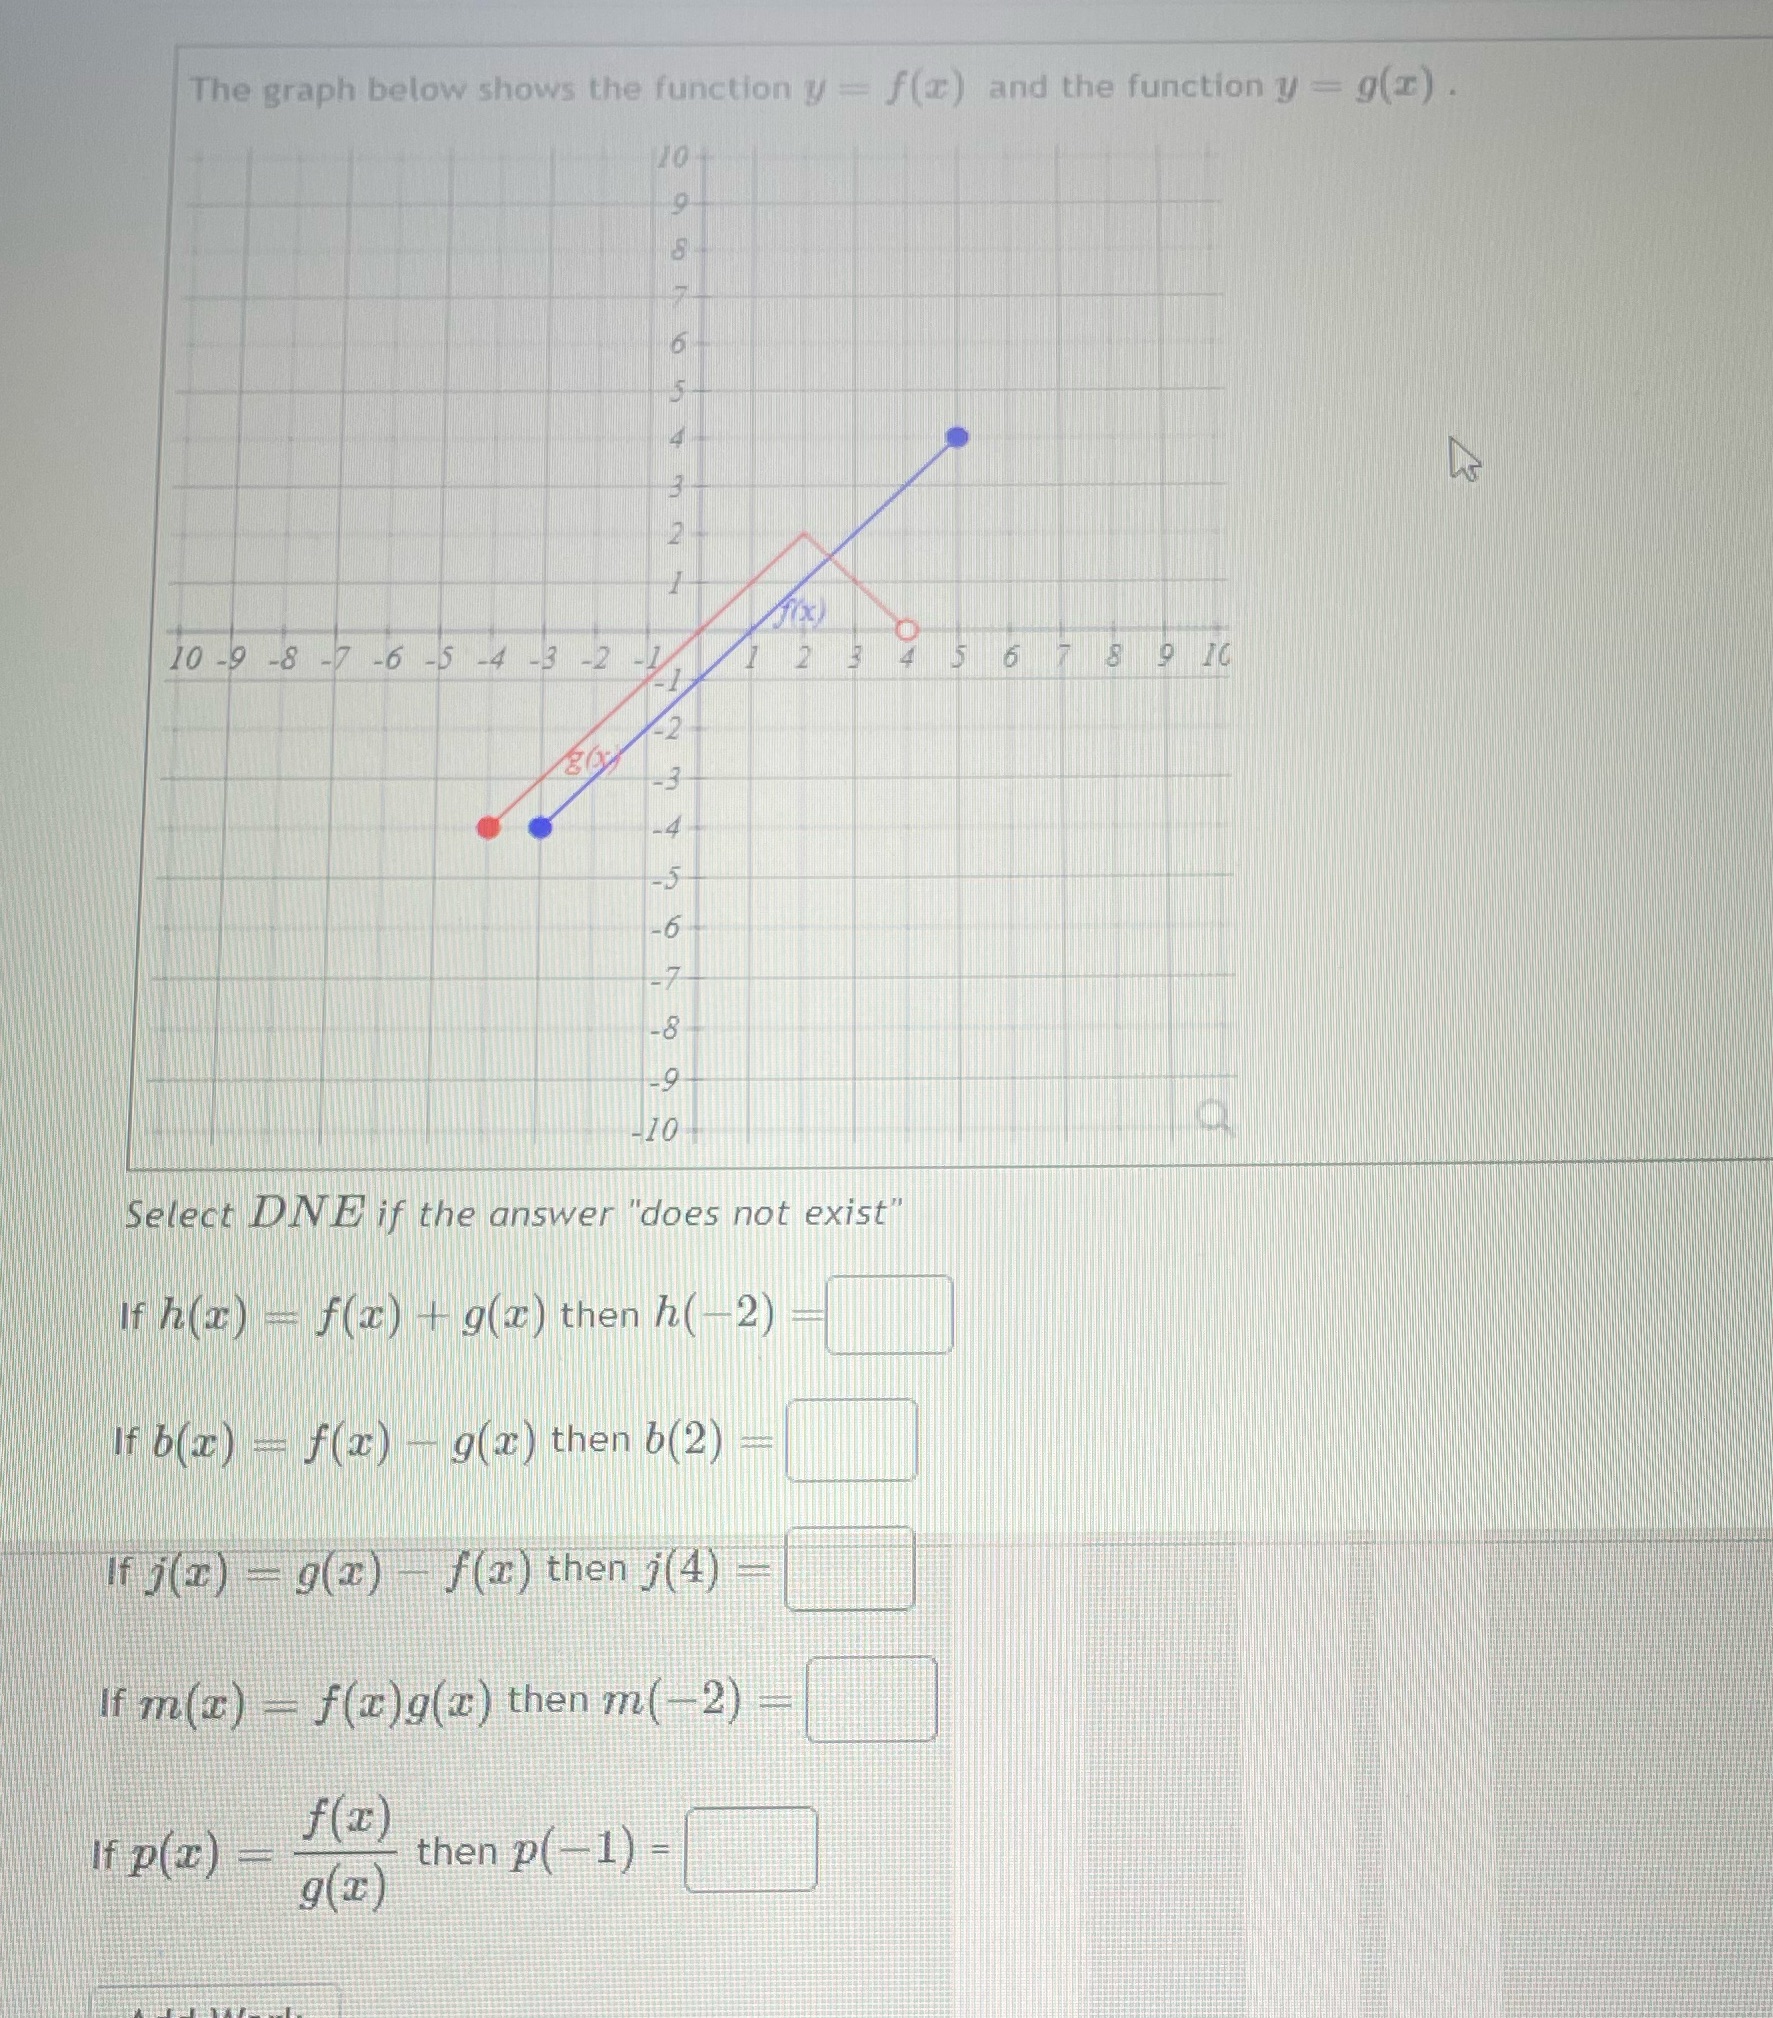
The graph below shows the function y - f(x) and the function y = 9(I) . 10 -9 -8 -7 -6 -5 -4 -3 -2 -1 1 2 3 45 6 7 8 9 10 Select DNE if the answer "does not exist" If h(I) - f(1) + 9(x) then h( 2) if b(z) - f(x) 9(2) then b(2) If j(I) - g(1) f(x) then j (4) If m(z) - f(x)g(x) then m(-2) - If p(z) _ J(x) then p( -1) = g(I)
Step by Step Solution
There are 3 Steps involved in it
1 Expert Approved Answer
Step: 1 Unlock

Question Has Been Solved by an Expert!
Get step-by-step solutions from verified subject matter experts
Step: 2 Unlock
Step: 3 Unlock