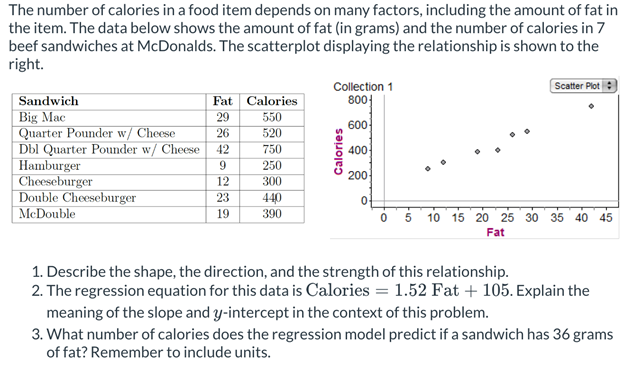
The number of calories in a food item depends on many factors, including the amount of...
Fantastic news! We've Found the answer you've been seeking!
Question:
Transcribed Image Text:
The number of calories in a food item depends on many factors, including the amount of fat in the item. The data below shows the amount of fat (in grams) and the number of calories in 7 beef sandwiches at McDonalds. The scatterplot displaying the relationship is shown to the right. Collection 1 Scatter Plot: Sandwich Fat Calories 800 Big Mac Quarter Pounder w/ Cheese Dbl Quarter Pounder w/ Cheese 42 Hamburger Cheeseburger Double Cheeseburger McDouble 29 550 600 26 520 750 400 9. 250 200 12 300 23 440 19 390 10 15 20 25 30 35 40 45 Fat 1. Describe the shape, the direction, and the strength of this relationship. 2. The regression equation for this data is Calories = 1.52 Fat + 105. Explain the meaning of the slope and y-intercept in the context of this problem. 3. What number of calories does the regression model predict if a sandwich has 36 grams of fat? Remember to include units. Calories The number of calories in a food item depends on many factors, including the amount of fat in the item. The data below shows the amount of fat (in grams) and the number of calories in 7 beef sandwiches at McDonalds. The scatterplot displaying the relationship is shown to the right. Collection 1 Scatter Plot: Sandwich Fat Calories 800 Big Mac Quarter Pounder w/ Cheese Dbl Quarter Pounder w/ Cheese 42 Hamburger Cheeseburger Double Cheeseburger McDouble 29 550 600 26 520 750 400 9. 250 200 12 300 23 440 19 390 10 15 20 25 30 35 40 45 Fat 1. Describe the shape, the direction, and the strength of this relationship. 2. The regression equation for this data is Calories = 1.52 Fat + 105. Explain the meaning of the slope and y-intercept in the context of this problem. 3. What number of calories does the regression model predict if a sandwich has 36 grams of fat? Remember to include units. Calories
Expert Answer:
Answer rating: 100% (QA)
Giren that the bure ber of Calories en a food tem depends s on many factors ncluding the amount of ... View the full answer
Related Book For
Elementary Statistics A step by step approach
ISBN: 978-0073386102
8th edition
Authors: Allan Bluman
Posted Date:
Students also viewed these accounting questions
-
The average number of calories in a 1.5-ounce chocolate bar is 225. Suppose that the distribution of calories is approximately normal with = 10 . Find the probability that a randomly selected...
-
Data are available on the number of calories in 12 ounces of beer for 101 different beers. Make a histogram to show the distribution of the numbers of calories, and describe the distribution. The...
-
The following data represent the number of calories per serving and the number of grams of sugar per serving for a random sample of high-fiber cereals. (a) Draw a scatter diagram of the data treating...
-
Suppose that a telephone switchboard of some company on the average handles 300 calls per hour, and that the board can make at most 10 connections per minute. Using the Poisson distribution, estimate...
-
In what order are current liabilities listed on the balance sheet? Why is this order important?
-
Let ( G, ) be a group. Consider the binary operation * on the set G defined by for a, b G. Show that ( G, *) is a group and that ( G, *) is actually isomorphic to ( G, ). a*b = b.a D
-
A fluid with a density of \(2000 \mathrm{~kg} / \mathrm{m}^{3}\) flows steadily between two flat plates as shown in Fig. P6.23. The bottom plate is fixed and the top one moves at a constant speed in...
-
The University of Chicago Press is wholly owned by the university. It performs the bulk of its work for other university departments, which pay as though the press were an outside business...
-
How would you respond to the following? (include questions for each response) Statement 1: Hi Destinee. Good work here, and thank you for your contributions to this thread. In hospitality,...
-
Univex is a calendar year, accrual basis retail business. Its financial statements provide the following information for the year: Revenues from sales of goods $ 783,200 Cost of goods sold (FIFO) ...
-
New Gen Corp Balance Sheet at 12/31/18 and Income Statement for 2018 ($ in Millions) Balance Sheet Assets Cash 13 Receivables (net) 25 Inventory 22 PP & E (net) 100 Goodwill 13 Total assets 173...
-
Suppose the total cost function is given by: C = 50 + 4Q + 2Q 2 a. What is the AFC of producing five units of output? b. What is the AVC of producing five units of output? c. What is the ATC of...
-
Consider the following demand curve: and the following supply curve: a. What is the equation of demand curve? b. What is the equation of the supply curve? c. Solve for equilibrium price and quantity...
-
What is the effect of a price ceiling on the quantity demanded?
-
Suppose the government mandates that airline ticket prices are too high and that they cannot exceed a certain amount. Using the concepts discussed in this chapter, what would be the short-term...
-
The JetGo Company is a major fixed-base operator (FBO) at a regional airport. Management estimates that the demand for the jet fuel is given by the equation: QJF = 10,000 2,000PJF + 0.2Y + 200PC...
-
1- Assume tuition is based on the number of credit hours up to a point of being a full-time student. If a student takes 12 credit hours per semester and pays $18,000, then decides to take an...
-
For the vector whose polar components are (Vr = 1, Vθ = 0), compute in polars all components of the second covariant derivative Vα;μ;ν. To find...
-
10.9, 20.2, 43.9, 9.5, 17.6, 5.6, 32.6, 0.85, 17.6 Rank the set of data.
-
Three brands of microwave dinners were advertised as low in sodium. Samples of the three different brands show the following milligrams of sodium. At = 0.05, is there a difference in the amount of...
-
A health care professional wishes to estimate the birth weights of infants. How large a sample must be obtained if she desires to be 90% confident that the true mean is within 2 ounces of the sample...
-
a. In Experiment 4A, set the sample frequency to 50 msec and measure the phase margin. b. Compare this with the phase margin with a 1-msec sample time (same as Question 1c). (DATA FROM QUETION 1C) c....
-
a. Using the DSA in Experiment 4A to generate open-loop Bode plots, what is the phase margin when the sample time is set to its default (0.00025 sec)? b. Repeat with a sample time of 0.0005 sec. c....
-
Using Experiment 3A, follow the zone-based tuning procedure of Section 3.5 using a square wave command with the following criteria: For KP, allow no overshoot. For KI, allow about 10% overshoot. a....
Study smarter with the SolutionInn App