

Question: The table below displays demand for a particular product for the months of June, July, and August. Alongside this time series are two forecasts. The
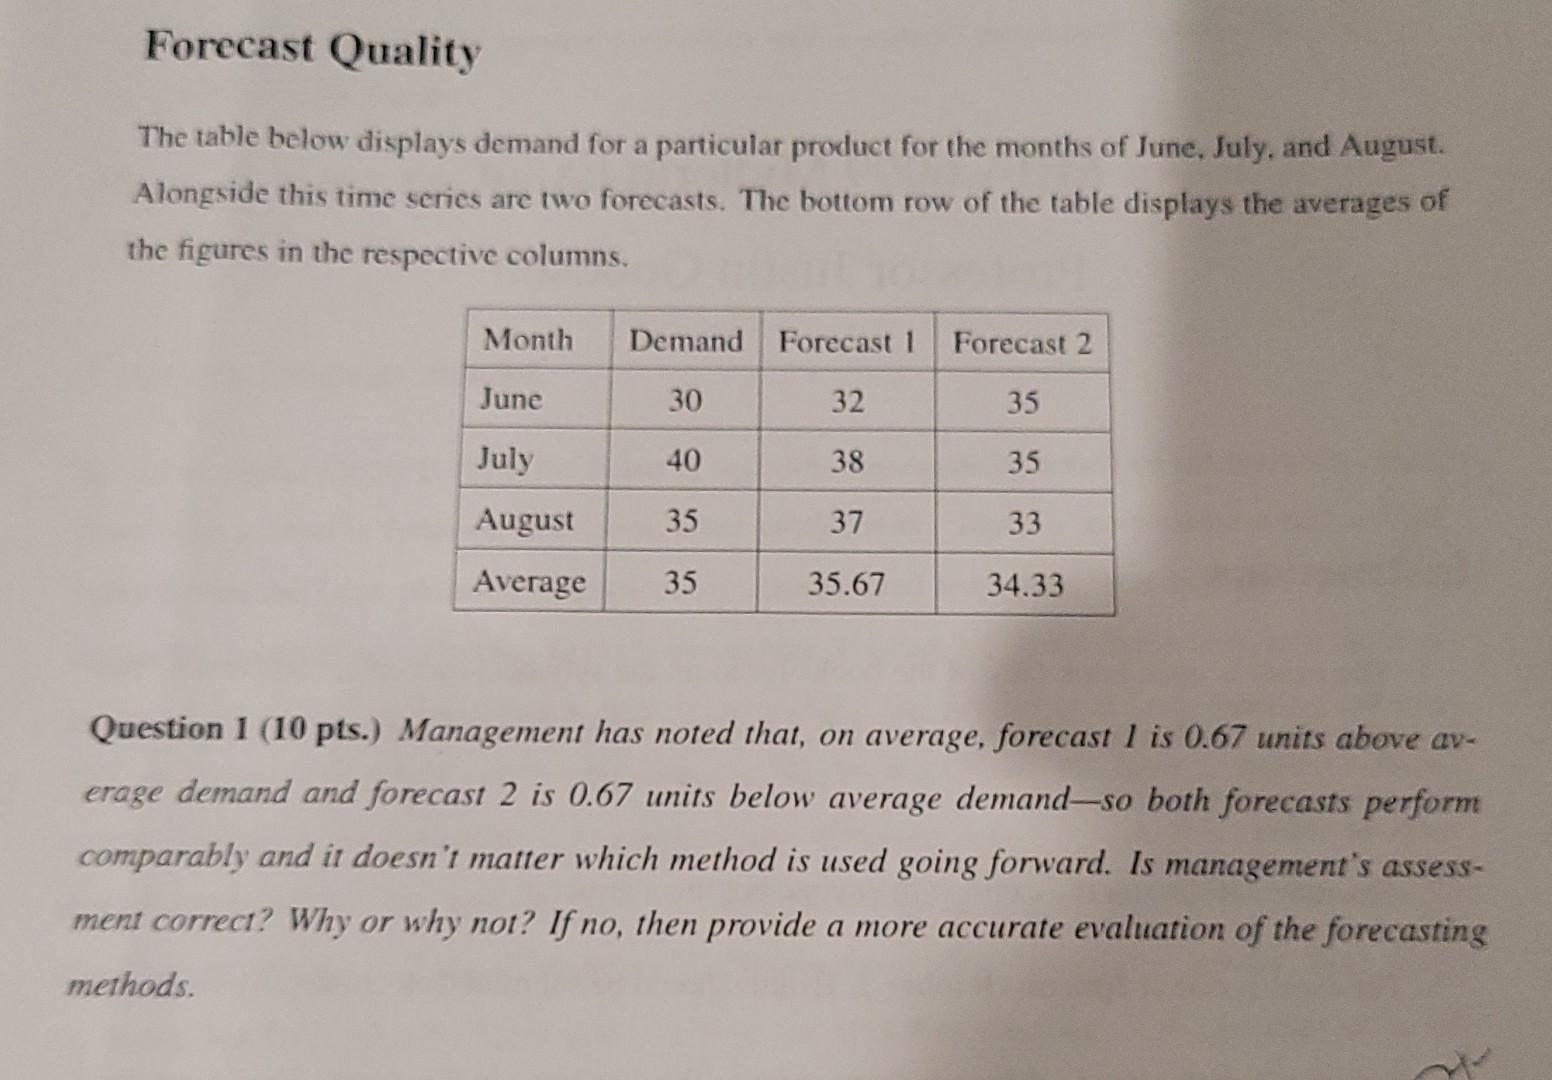
The table below displays demand for a particular product for the months of June, July, and August. Alongside this time series are two forecasts. The bottom row of the table displays the averages of the figures in the respective columns. Question 1 (10 pts.) Management has noted that, on average, forecast 1 is 0.67 units above average demand and forecast 2 is 0.67 units below average demand-so both forecasts perform comparably' and it doesn't matter which method is used going forward. Is management's assessment correct? Why or why not? If no, then provide a more accurate evaluation of the forecasting methods
Step by Step Solution
There are 3 Steps involved in it
1 Expert Approved Answer
Step: 1 Unlock

Question Has Been Solved by an Expert!
Get step-by-step solutions from verified subject matter experts
Step: 2 Unlock
Step: 3 Unlock