

Question: TrainCo Timetable NYC-Schenectady TrainCo Timetable Schenectody-NYC Task 2-2) Create a Box plot that compares the added times of departure for old and new data by
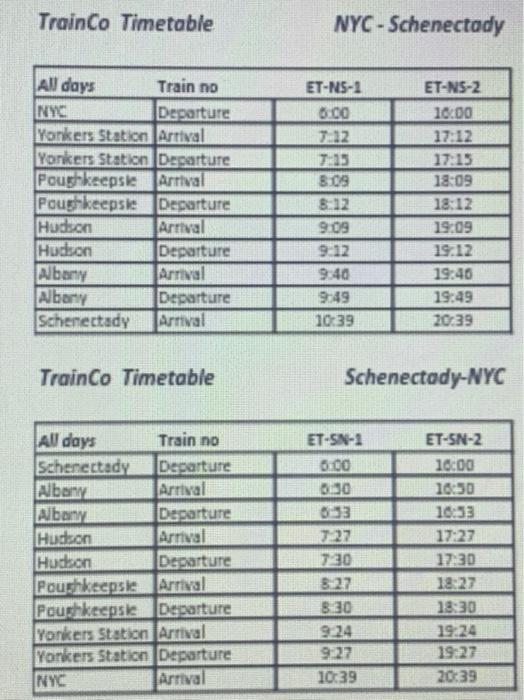
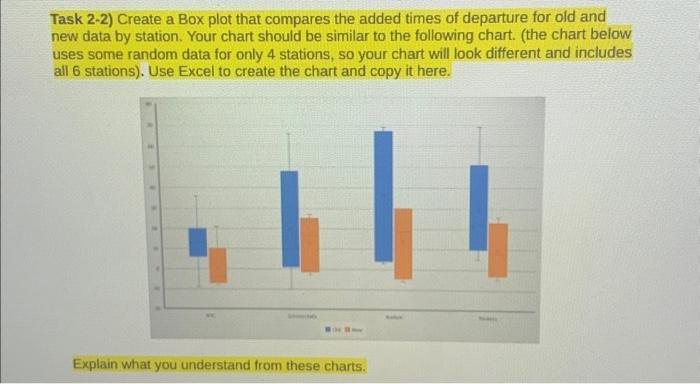
TrainCo Timetable NYC-Schenectady TrainCo Timetable Schenectody-NYC Task 2-2) Create a Box plot that compares the added times of departure for old and new data by station. Your chart should be similar to the following chart. (the chart below uses some random data for only 4 stations, so your chart will look different and includes all 6 stations). Use Excel to create the chart and copy it here. Explain what you understand from these charts
Step by Step Solution
There are 3 Steps involved in it
1 Expert Approved Answer
Step: 1 Unlock

Question Has Been Solved by an Expert!
Get step-by-step solutions from verified subject matter experts
Step: 2 Unlock
Step: 3 Unlock