

Question: USE MATLAB 5. (5 points) Fit the following data using the polyfit(xxn) function and allow the value of n to be greater than 1. Try
 USE MATLAB
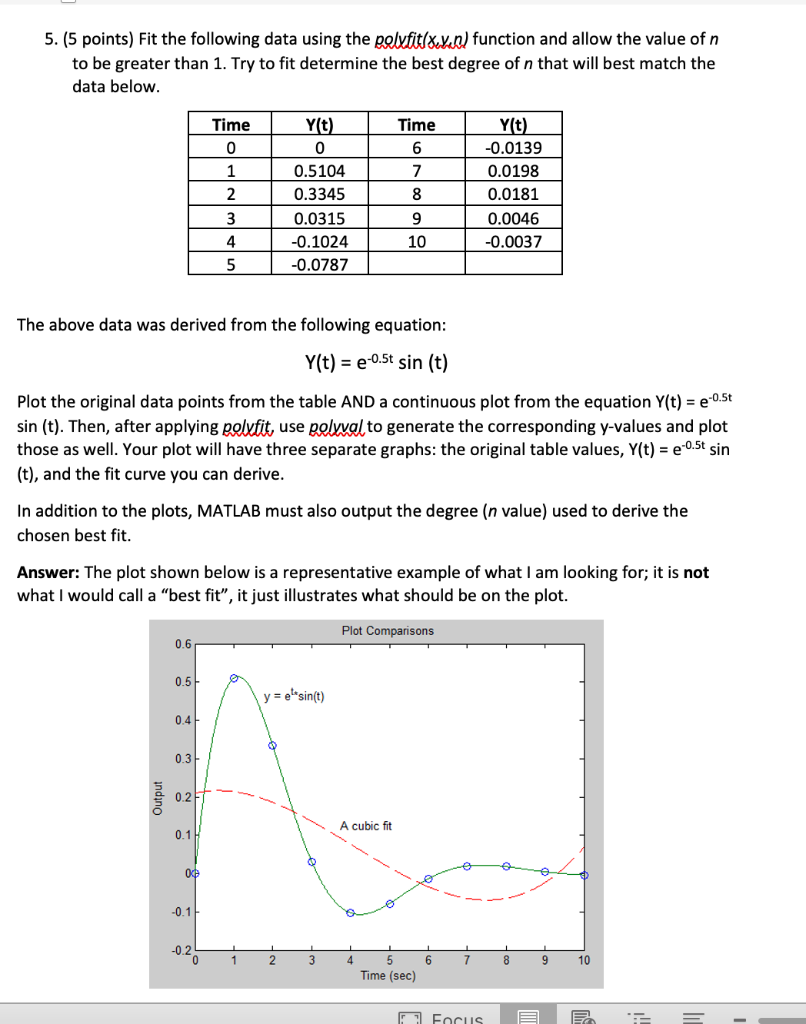
5. (5 points) Fit the following data using the polyfit(xxn) function and allow the value of n to be greater than 1. Try to fit determine the best degree of n that will best match the data below. Time 0 Yt) 0 Time 6 1 7 Y(t) -0.0139 0.0198 0.0181 0.0046 -0.0037 2 8 0.5104 0.3345 0.0315 -0.1024 -0.0787 3 9 10 4 5 The above data was derived from the following equation: Y(t) = e-0.5t sin (t) Plot the original data points from the table AND a continuous plot from the equation y(t) = -0.5t sin (t). Then, after applying polyfit, use polyval to generate the corresponding y-values and plot those as well. Your plot will have three separate graphs: the original table values, y(t) = e-0.5t sin (t), and the fit curve you can derive. In addition to the plots, MATLAB must also output the degree (n value) used to derive the chosen best fit. Answer: The plot shown below is a representative example of what I am looking for; it is not what I would call a "best fit, it just illustrates what should be on the plot. Plot Comparisons 0.6 0.5 e y = etsin(t) 0.4 0.3 Output 0.2 A cubic fit 0.1 O 06 -0.11 -0.2 0 1 2 3 4 6 7 8 9 10 5 Time (sec) F Focus
Step by Step Solution
There are 3 Steps involved in it

Get step-by-step solutions from verified subject matter experts