

Question: Use Python codes to calculate and plot the DFT of the impulse described below. From your simulation results compare the spectrum of the impulse. The
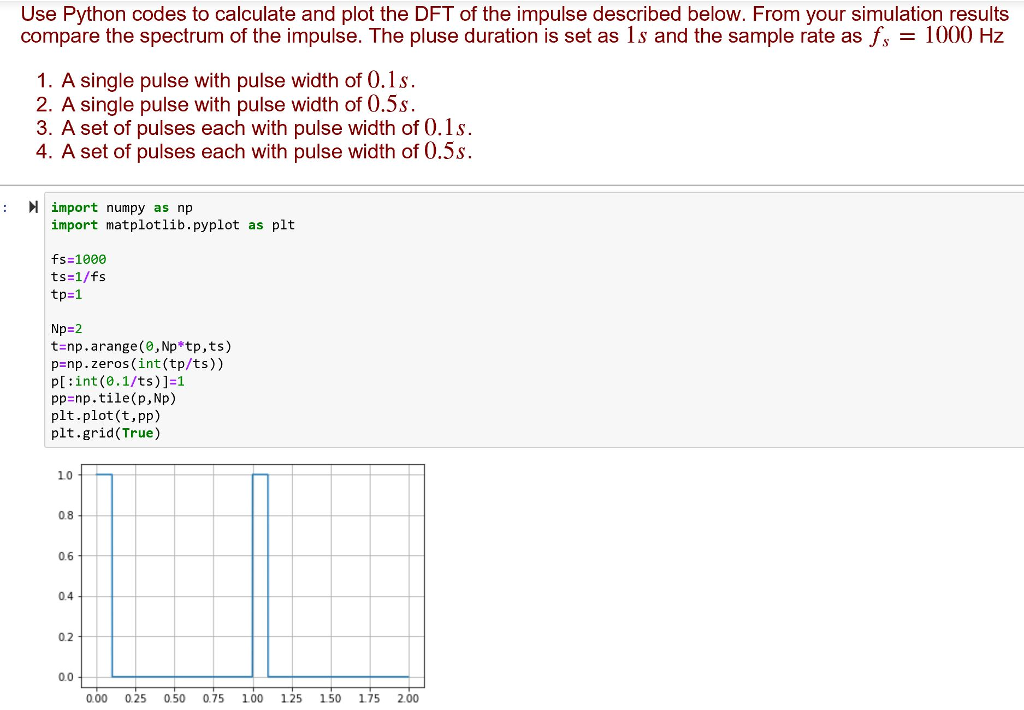
Use Python codes to calculate and plot the DFT of the impulse described below. From your simulation results compare the spectrum of the impulse. The pluse duration is set as 1s and the sample rate as 1000 Hz 1. A single pulse with pulse width of 0.1s. 2. A single pulse with pulse width of 0.5s. 3. A set of pulses each with pulse width of 0.1s. 4. A set of pulses each with pulse width of 0.5s. : import numpy as np import matplotlib.pyplot as plt fs-1006 ts-1/fs tp-1 Np 2 t-np.arange(0, Np*tp,ts) p-np.zeros (int (tp/ts) pl:int (0.1/ts)]-1 pp-np.tile (p,Np) plt.plot(t,pp) plt.grid (True) 1.0 0.8 0.6 04 0.2 0.0 0.00 0.25 050 075 100 125 150 175 2.00 Use Python codes to calculate and plot the DFT of the impulse described below. From your simulation results compare the spectrum of the impulse. The pluse duration is set as 1s and the sample rate as 1000 Hz 1. A single pulse with pulse width of 0.1s. 2. A single pulse with pulse width of 0.5s. 3. A set of pulses each with pulse width of 0.1s. 4. A set of pulses each with pulse width of 0.5s. : import numpy as np import matplotlib.pyplot as plt fs-1006 ts-1/fs tp-1 Np 2 t-np.arange(0, Np*tp,ts) p-np.zeros (int (tp/ts) pl:int (0.1/ts)]-1 pp-np.tile (p,Np) plt.plot(t,pp) plt.grid (True) 1.0 0.8 0.6 04 0.2 0.0 0.00 0.25 050 075 100 125 150 175 2.00
Step by Step Solution
There are 3 Steps involved in it

Get step-by-step solutions from verified subject matter experts