

Question: Use Python to solve the following problem: (stinkbug.png picture below) 3. Use the matplotlib.image.imread command to load the stinkbug.png file, which returns a NumPy array
Use Python to solve the following problem:
("stinkbug.png" picture below)
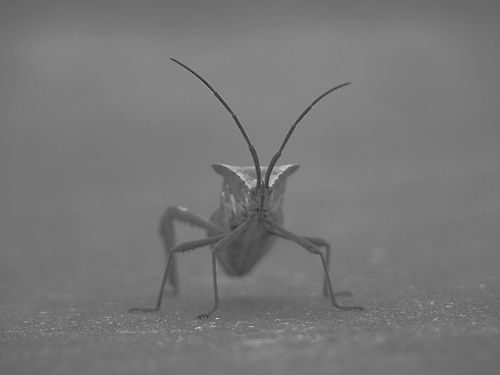
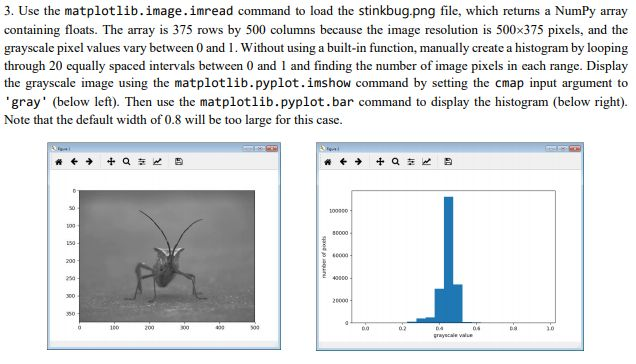
3. Use the matplotlib.image.imread command to load the stinkbug.png file, which returns a NumPy array containing floats. The array is 375 rows by 500 columns because the image resolution is 500x375 pixels, and the grayscale pixel values vary between 0 and 1. Without using a built-in function, manually create a histogram by looping through 20 equally spaced intervals between 0 and 1 and finding the number of image pixels in cach range. Display the grayscale image using the matplotlib.pyplot.imshow command by setting the cmap input argument to gray' (below left). Then use the matplotlib.pyplot.bar command to display the histogram (below right). Note that the default width of 0.8 wl be too large for this case. 3 60000
Step by Step Solution
There are 3 Steps involved in it

Get step-by-step solutions from verified subject matter experts