

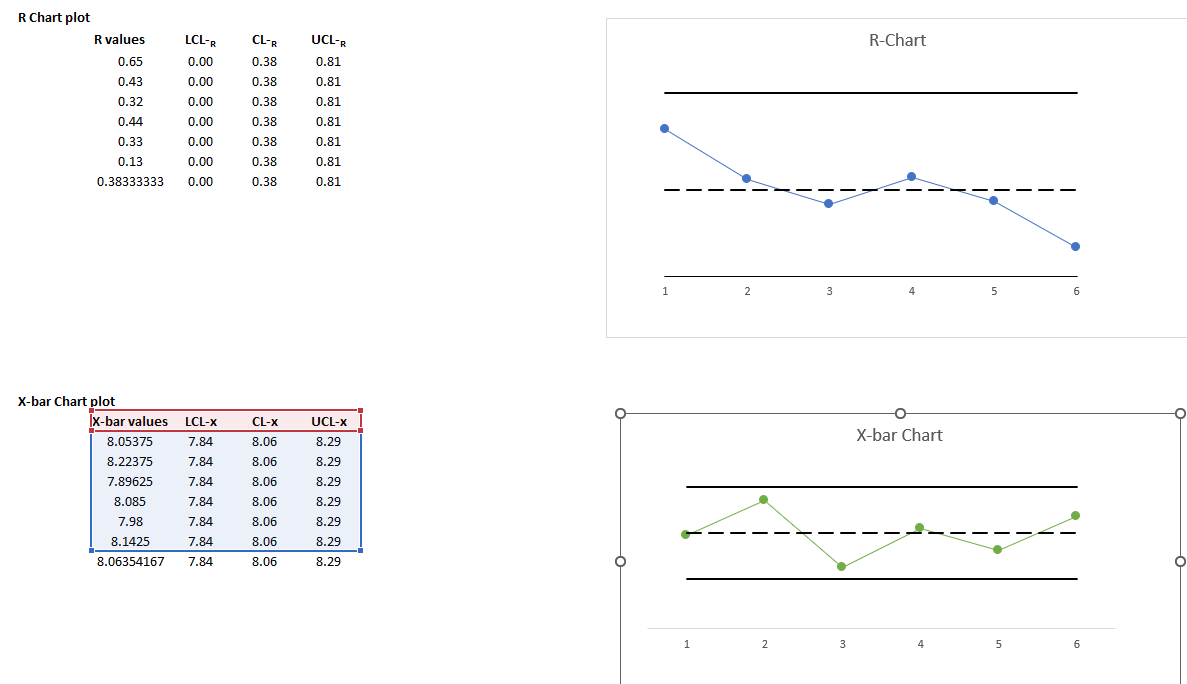
Question: Use R Chart and X - bar Chart plot to answer the following: Based on the x - bar chart and R - chart Is
Use R Chart and Xbar Chart plot to answer the following:
Based on the xbar chart and Rchart Is the process in statistical control? Justify your answer with a discussion about whether the process spread, process average, or both are in a state of control, and why or why not
Step by Step Solution
There are 3 Steps involved in it
1 Expert Approved Answer
Step: 1 Unlock

Question Has Been Solved by an Expert!
Get step-by-step solutions from verified subject matter experts
Step: 2 Unlock
Step: 3 Unlock