

Question: Use the list as reference for the problem Refer to Table 56.1 - Factors for Computing Control Chart Limits (3 sigma) for this problem. Twelve
Use the list as reference for the problem
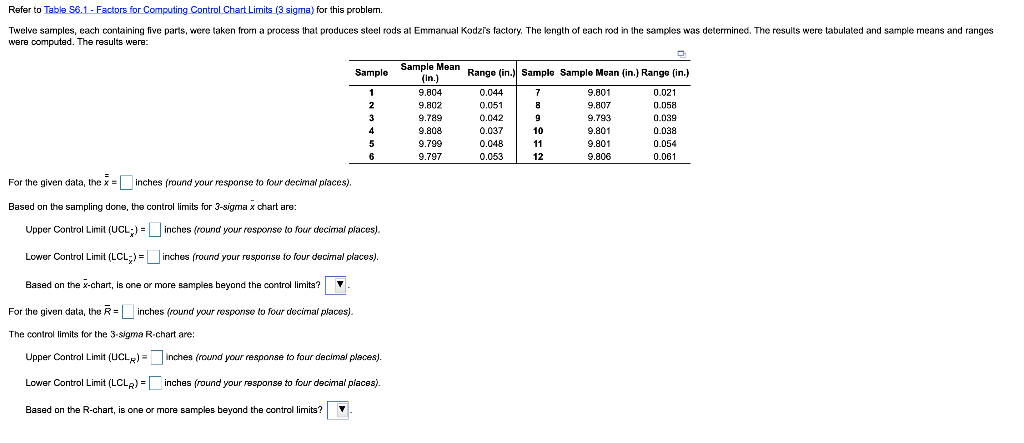
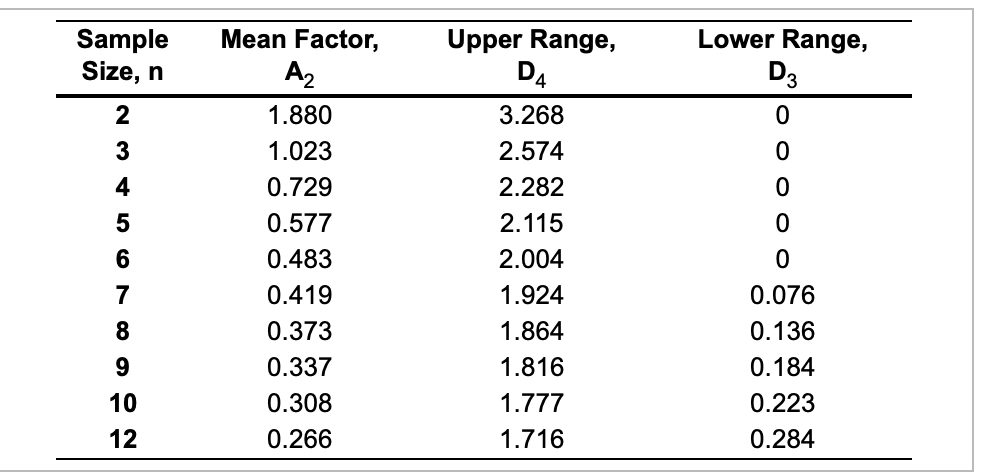
Refer to Table 56.1 - Factors for Computing Control Chart Limits (3 sigma) for this problem. Twelve samples, each containing live parts, were taken from a process that produces steel rods at Emmanual Kodzi's factory. The length of each rod in the samples was determined. The results were tabulated and sample means and ranges were computed. The results were: Sample 9.807 1 2 3 4 5 6 Sample Mean Range (in.) Sample Sample Mean (in.) Range (in.) (in.) 9.804 0.044 7 9.801 0.021 9.802 0.051 0.058 9.789 0.042 9 9.793 0.039 9.808 0.037 10 9.801 0.038 9.799 0.048 11 9.801 0.054 9.797 0.053 12 9.806 0.061 For the given data, the x = inches (round your response to four decimal places). Based on the sampling done, the control limits for 3-sigma x chart are: Upper Control Limit (UCL;) - inches (round your response to four decimal places). Lower Control Limit (LCL;) - inches (round your response to four decimal places). Based on the x-chart, is one or more samples beyond the control limits? For the given data, the Rinches (round your response to four decimal places). The control limits for the 3-sigma R-chart are: Upper Control Limit (UCL) = inches (round your response to four decimal places). Lower Control Limit (LCLR) - inches (round your response to four decimal places). Based on the R-chart, is one or more samples beyond the control limits? Sample Size, n Lower Range, D3 2 0 3 0 4 0 5 0 Mean Factor, Az 1.880 1.023 0.729 0.577 0.483 0.419 0.373 0.337 0.308 0.266 Upper Range, D4 3.268 2.574 2.282 2.115 2.004 1.924 1.864 1.816 1.777 1.716 6 0 7 8 9 0.076 0.136 0.184 0.223 0.284 10 12Step by Step Solution
There are 3 Steps involved in it
1 Expert Approved Answer
Step: 1 Unlock

Question Has Been Solved by an Expert!
Get step-by-step solutions from verified subject matter experts
Step: 2 Unlock
Step: 3 Unlock