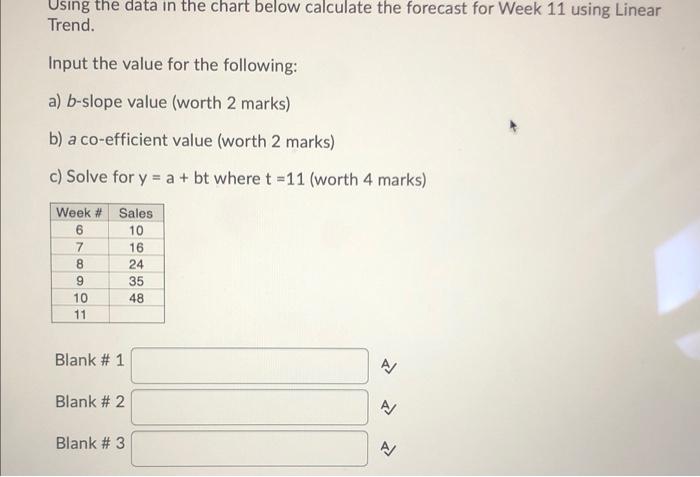
Question: Using the data in the chart below calculate the forecast for Week 11 using Linear Trend. Input the value for the following: a) b-slope value

Using the data in the chart below calculate the
Using the data in the chart below calculate the forecast for Week 11 using Linear Trend. Input the value for the following: a) b-slope value (worth 2 marks) b) a co-efficient value (worth 2 marks) c) Solve for y = a + bt where t =11 (worth 4 marks) Week # Sales 6 10 7 16 24 9 35 10 48 11 OOOOO Blank # 1 AM Blank # 2 Blank # 3

Step by Step Solution

There are 3 Steps involved in it

1 Expert Approved Answer
Step: 1 Unlock blur-text-image
Question Has Been Solved by an Expert!

Get step-by-step solutions from verified subject matter experts

Step: 2 Unlock
Step: 3 Unlock

Students Have Also Explored These Related General Management Questions!