

Question: Using the information below explain in a brief paragraph what has happened to Netflix's financial leverage position? Total Asset Turnover Ratio: Industry Average (Disney 2020):
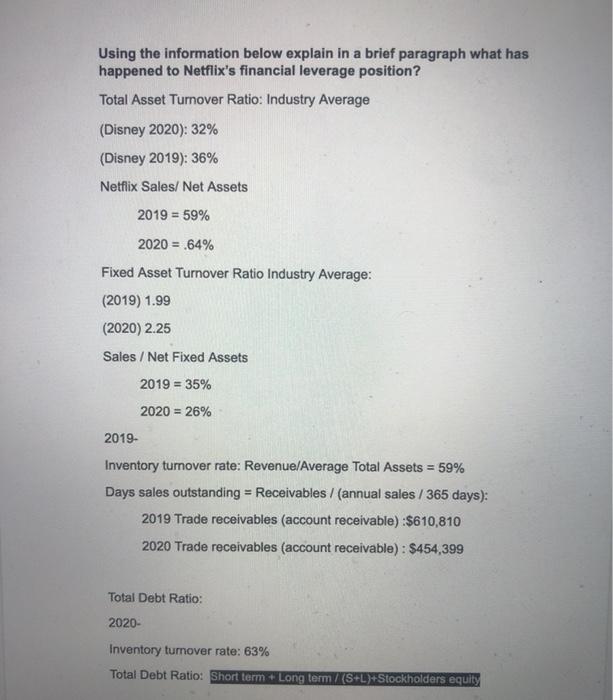
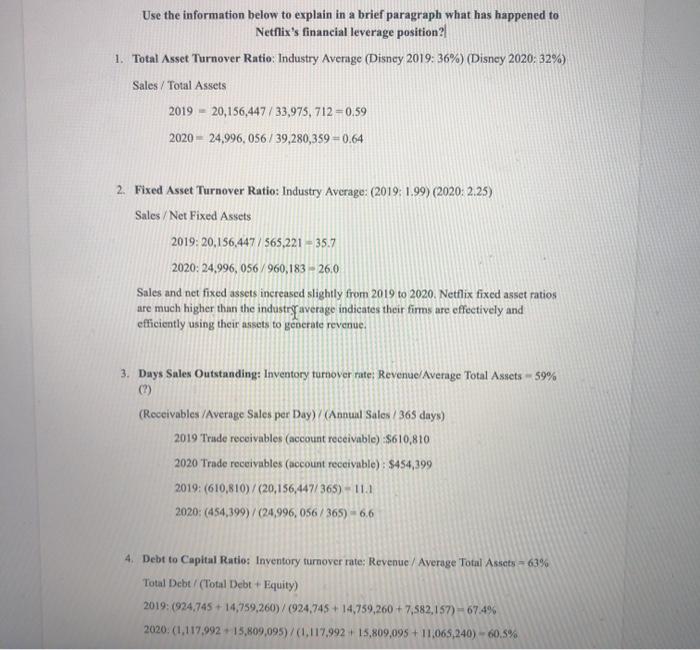
Using the information below explain in a brief paragraph what has happened to Netflix's financial leverage position? Total Asset Turnover Ratio: Industry Average (Disney 2020): 32% (Disney 2019): 36% Netflix Sales/ Net Assets 2019 = 59% 2020 = 64% Fixed Asset Turnover Ratio Industry Average: (2019) 1.99 (2020) 2.25 Sales / Net Fixed Assets 2019 = 35% 2020 = 26% 2019- Inventory turnover rate: Revenue/Average Total Assets = 59% Days sales outstanding = Receivables / (annual sales / 365 days): 2019 Trade receivables (account receivable) :$610,810 2020 Trade receivables (account receivable): $454,399 Total Debt Ratio: 2020- Inventory turnover rate: 63% Total Debt Ratio: Short term + Long term / (S+L)+Stockholders equity Use the information below to explain in a brief paragraph what has happened to Netflix's financial leverage position? 1. Total Asset Turnover Ratio: Industry Average (Disney 2019: 36%) (Disney 2020: 32%) Sales/ Total Assets 2019 - 20,156,447/33,975, 712 =0.59 2020 - 24,996, 056/ 39,280,359 -0.64 2. Fixed Asset Turnover Ratio: Industry Average: (2019: 1.99) (2020 2.25) Sales / Net Fixed Assets 2019: 20,156,447/565,221 - 35.7 2020: 24.996, 056/960,183 - 26.0 Sales and net fixed assets increased slightly from 2019 to 2020. Netflix fixed asset ratios are much higher than the industry average indicates their firms are effectively and efficiently using their assets to generate revenue. 3. Days Sales Outstanding: Inventory turnover rate: Revenue/Average Total Assets - 59% (?) (Receivables/Average Sales per Day)/(Annual Sales / 365 days) 2019 Trade receivables (account receivable) $610,810 2020 Trade receivables (account receivable): S454,399 2019: (610,810)/(20,156,447/365) - 11.1 2020: (454,399)/(24,996, 056/365) 6.6 4. Debt to Capital Ratio: Inventory turnover rate: Revenue / Average Total Assets 63% Total Debt / (Total Debt + Equity) 2019: (924,745 +14,759,260)/(924,745 +14,759,260 + 7,582,157) - 67.4% 2020: (1.117.992 +15,809,095)/(1.117.992 +15,809,095 + 11,065,240) - 60.5%
Step by Step Solution
There are 3 Steps involved in it

Get step-by-step solutions from verified subject matter experts