

Question: Using the information shown below, answer the following questions below. 7. Which portfolio would you choose and why (there's no right or wrong answer here,
Using the information shown below, answer the following questions below.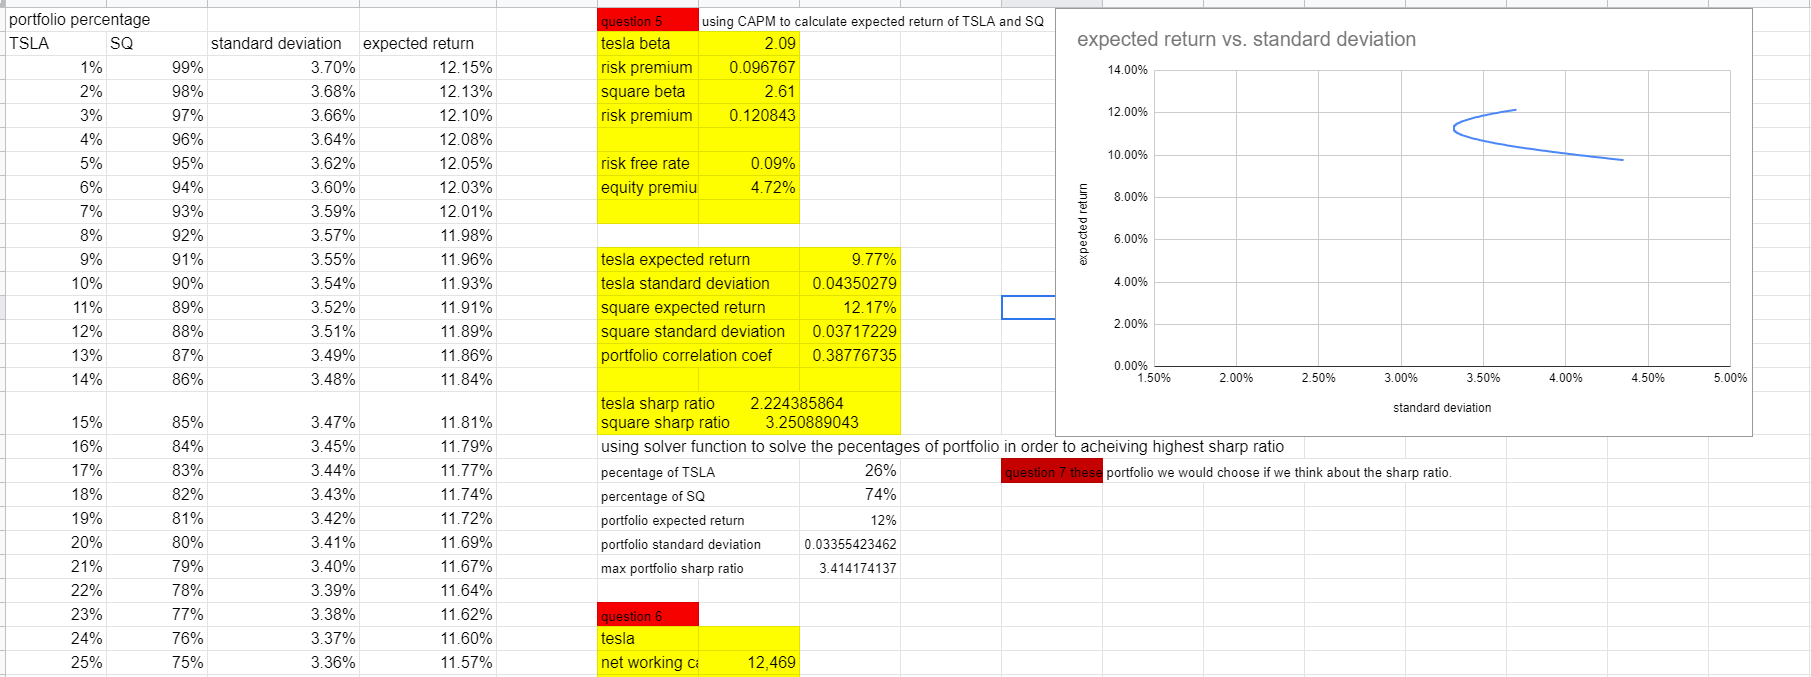
7. Which portfolio would you choose and why (there's no right or wrong answer here, just argue which one you like best in words)?
8. For your favorite portfolio combination, compute daily returns of this portfolio and compare them to the daily returns of each of the individual stocks you have chosen (we leave it fully up to you how you want to "compare").
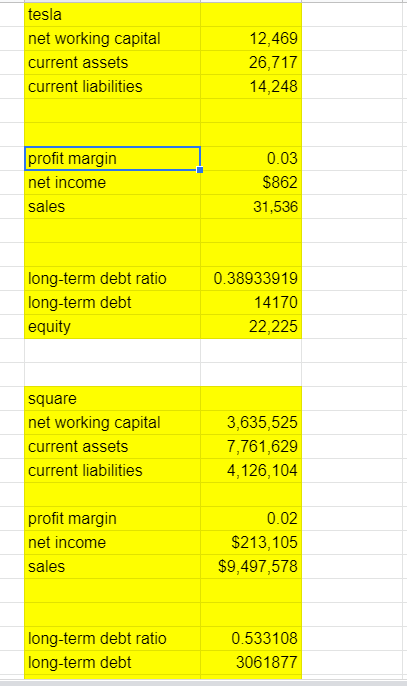
expected return vs. standard deviation question 5 tesla beta risk premium square beta risk premium using CAPM to calculate expected return of TSLA and SQ 2.09 0.096767 2.61 0.120843 14.00% 12.00% 10.00% risk free rate equity premiu 0.09% 4.72% portfolio percentage TSLA SQ 1% 2% 3% 4% 5% 6% 7% 8% 9% 10% 11% 12% 13% 14% 8.00% standard deviation expected return 99% 3.70% 12.15% 98% 3.68% 12.13% 97% 3.66% 12.10% 96% 3.64% 12.08% 95% 3.62% 12.05% 94% 3.60% 12.03% 93% 3.59% 12.01% 92% 3.57% 11.98% 91% 3.55% 11.96% 90% 3.54% 11.93% 89% 3.52% 11.91% 88% 3.51% 11.89% 87% 3.49% 11.86% 86% 3.48% 11.84% expected return 3.00% 4.00% 4.50% 5.00% 6.00% tesla expected return 9.77% tesla standard deviation 0.04350279 4.00% square expected return 12.17% square standard deviation 0.03717229 2.00% portfolio correlation coef 0.38776735 0.00% 1.50% 2.00% 2.50% 3.50% tesla sharp ratio 2.224385864 standard deviation square sharp ratio 3.250889043 using solver function to solve the pecentages of portfolio in order to acheiving highest sharp ratio pecentage of TSLA 26% question 7 these portfolio we would choose if we think about the sharp ratio. percentage of SQ 74% portfolio expected return 12% portfolio standard deviation 0.03355423462 max portfolio sharp ratio 3.414174137 15% 16% 17% 18% 19% 20% 21% 22% 23% 24% 25% 85% 84% 83% 82% 81% 80% 79% 78% 77% 76% 75% 3.47% 3.45% 3.44% 3.43% 3.42% 3.41% 3.40% 3.39% 3.38% 3.37% 3.36% 11.81% 11.79% 11.77% 11.74% 11.72% 11.69% 11.67% 11.64% 11.62% 11.60% 11.57% question 6 tesla net working a 12,469 tesla net working capital current assets current liabilities 12,469 26,717 14,248 profit margin net income sales 0.03 $862 31,536 long-term debt ratio long-term debt equity 0.38933919 14170 22,225 square net working capital current assets current liabilities 3,635,525 7,761,629 4,126,104 profit margin net income sales 0.02 $213,105 $9,497,578 long-term debt ratio long-term debt 0.533108 3061877 expected return vs. standard deviation question 5 tesla beta risk premium square beta risk premium using CAPM to calculate expected return of TSLA and SQ 2.09 0.096767 2.61 0.120843 14.00% 12.00% 10.00% risk free rate equity premiu 0.09% 4.72% portfolio percentage TSLA SQ 1% 2% 3% 4% 5% 6% 7% 8% 9% 10% 11% 12% 13% 14% 8.00% standard deviation expected return 99% 3.70% 12.15% 98% 3.68% 12.13% 97% 3.66% 12.10% 96% 3.64% 12.08% 95% 3.62% 12.05% 94% 3.60% 12.03% 93% 3.59% 12.01% 92% 3.57% 11.98% 91% 3.55% 11.96% 90% 3.54% 11.93% 89% 3.52% 11.91% 88% 3.51% 11.89% 87% 3.49% 11.86% 86% 3.48% 11.84% expected return 3.00% 4.00% 4.50% 5.00% 6.00% tesla expected return 9.77% tesla standard deviation 0.04350279 4.00% square expected return 12.17% square standard deviation 0.03717229 2.00% portfolio correlation coef 0.38776735 0.00% 1.50% 2.00% 2.50% 3.50% tesla sharp ratio 2.224385864 standard deviation square sharp ratio 3.250889043 using solver function to solve the pecentages of portfolio in order to acheiving highest sharp ratio pecentage of TSLA 26% question 7 these portfolio we would choose if we think about the sharp ratio. percentage of SQ 74% portfolio expected return 12% portfolio standard deviation 0.03355423462 max portfolio sharp ratio 3.414174137 15% 16% 17% 18% 19% 20% 21% 22% 23% 24% 25% 85% 84% 83% 82% 81% 80% 79% 78% 77% 76% 75% 3.47% 3.45% 3.44% 3.43% 3.42% 3.41% 3.40% 3.39% 3.38% 3.37% 3.36% 11.81% 11.79% 11.77% 11.74% 11.72% 11.69% 11.67% 11.64% 11.62% 11.60% 11.57% question 6 tesla net working a 12,469 tesla net working capital current assets current liabilities 12,469 26,717 14,248 profit margin net income sales 0.03 $862 31,536 long-term debt ratio long-term debt equity 0.38933919 14170 22,225 square net working capital current assets current liabilities 3,635,525 7,761,629 4,126,104 profit margin net income sales 0.02 $213,105 $9,497,578 long-term debt ratio long-term debt 0.533108 3061877
Step by Step Solution
There are 3 Steps involved in it

Get step-by-step solutions from verified subject matter experts