Question: What does the data in case Exhibits 3 and 4 reveal about iRobots financial and operating performance? iRobot Corporation's Consolidated Statements of Income, Fiscal Year
What does the data in case Exhibits 3 and 4 reveal about iRobots financial and operating performance?
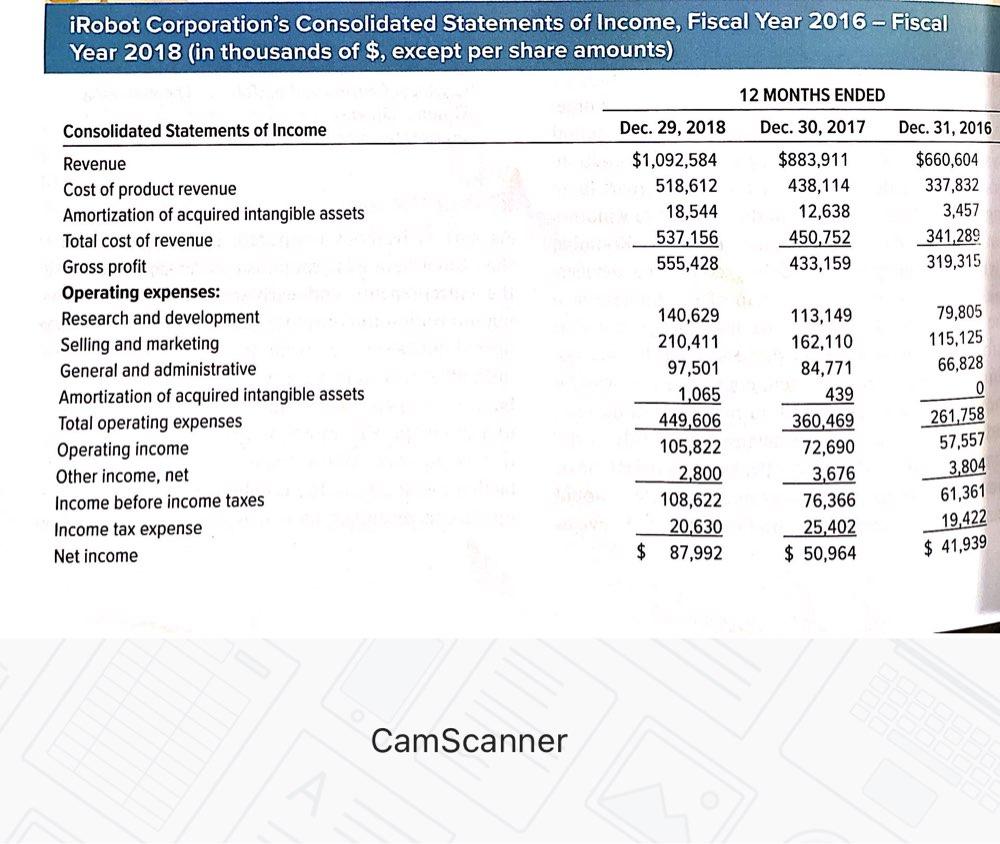
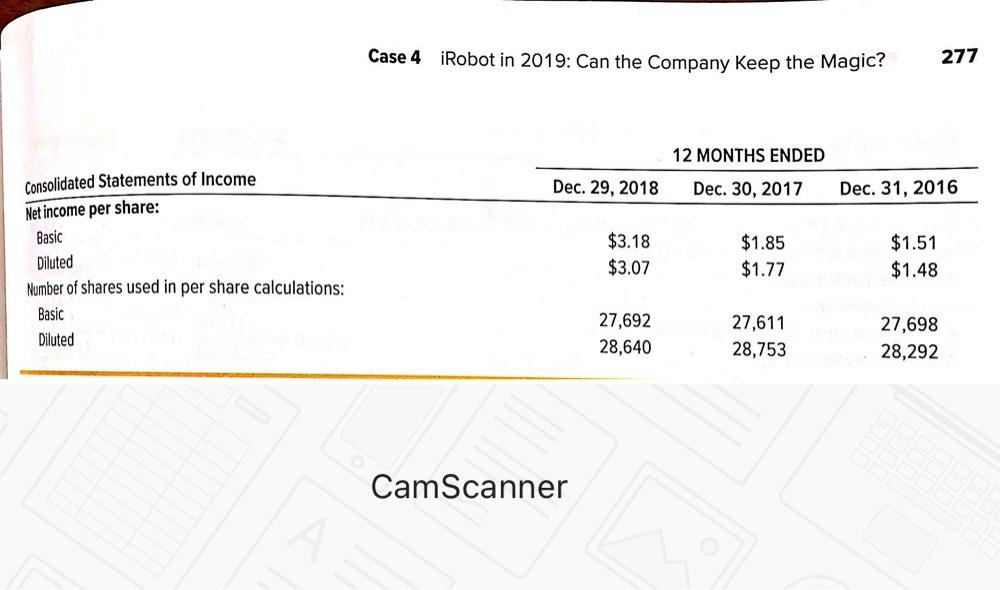
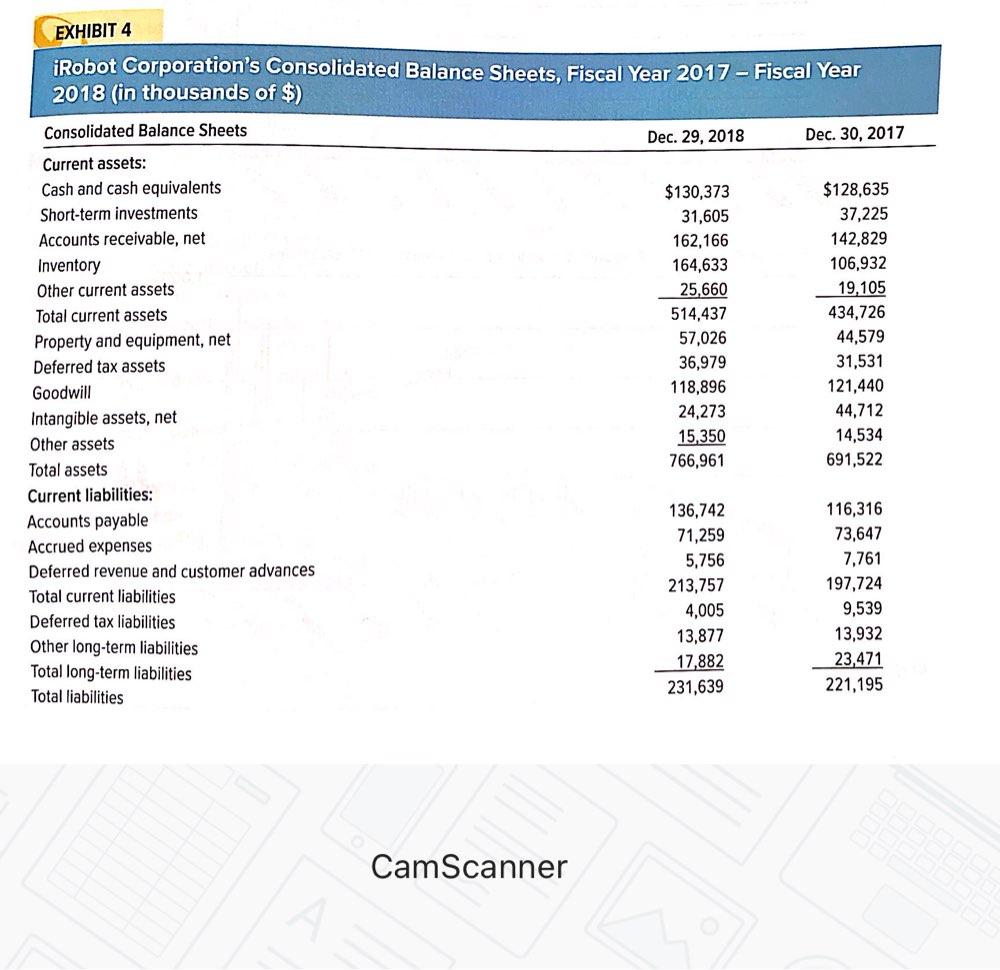
iRobot Corporation's Consolidated Statements of Income, Fiscal Year 2016 - Fiscal Year 2018 (in thousands of $, except per share amounts) 12 MONTHS ENDED Consolidated Statements of Income Dec. 31, 2016 Dec. 29, 2018 $1,092,584 518,612 18,544 537,156 555,428 Dec. 30, 2017 $883,911 438,114 12,638 450,752 433,159 $660,604 337,832 3,457 341,289 319,315 Revenue Cost of product revenue Amortization of acquired intangible assets Total cost of revenue Gross profit Operating expenses: Research and development Selling and marketing General and administrative Amortization of acquired intangible assets Total operating expenses Operating income Other income, net Income before income taxes Income tax expense Net income 79,805 115.125 66,828 0 261,758 140,629 210,411 97,501 1,065 449,606 105,822 2,800 108,622 20,630 $ 87,992 113,149 162,110 84,771 439 360,469 72,690 3,676 76,366 25,402 $ 50,964 57,557 3,804 61,361 19,422 $ 41,939 CamScanner Case 4 iRobot in 2019: Can the Company Keep the Magic? 277 12 MONTHS ENDED Dec. 29, 2018 Dec. 30, 2017 Dec. 31, 2016 Consolidated Statements of Income Net income per share: Basic Diluted Number of shares used in per share calculations: $3.18 $3.07 $1.85 $1.77 $1.51 $1.48 Basic Diluted 27,692 28,640 27,611 28,753 27,698 28,292 CamScanner EXHIBIT 4 iRobot Corporation's Consolidated Balance Sheets, Fiscal Year 2017 - Fiscal Year 2018 (in thousands of $) Consolidated Balance Sheets Dec. 29, 2018 Dec. 30, 2017 $130,373 31,605 162,166 164,633 25,660 514,437 57,026 36,979 118,896 24,273 15,350 766,961 $128,635 37,225 142,829 106,932 19,105 434,726 44,579 Current assets: Cash and cash equivalents Short-term investments Accounts receivable, net Inventory Other current assets Total current assets Property and equipment, net Deferred tax assets Goodwill Intangible assets, net Other assets Total assets Current liabilities: Accounts payable Accrued expenses Deferred revenue and customer advances Total current liabilities Deferred tax liabilities Other long-term liabilities Total long-term liabilities Total liabilities 31,531 121,440 44,712 14,534 691,522 136,742 71,259 5,756 213,757 4,005 13,877 17,882 231,639 116,316 73,647 7,761 197,724 9,539 13,932 23,471 221,195 ting CamScanner


