

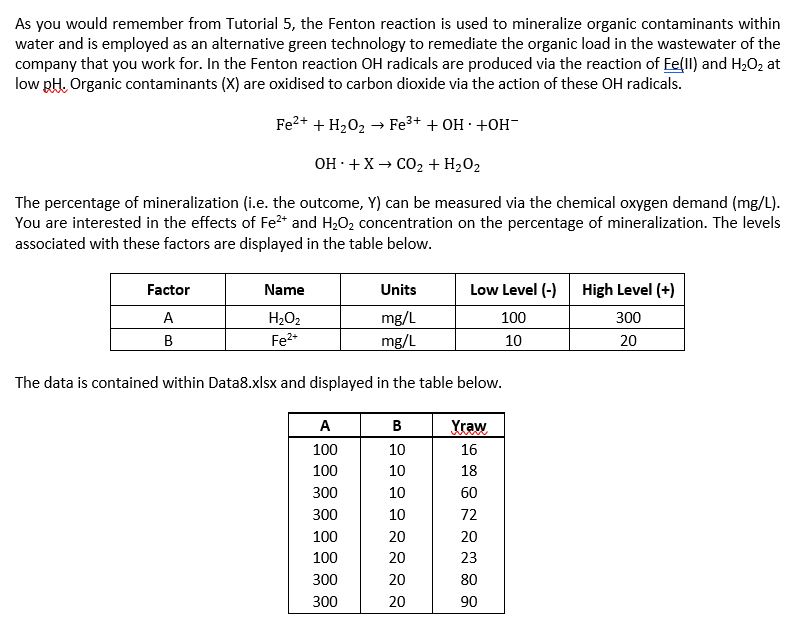
Question: What does this surface plot indicate? How would you maximise the mineralization of organic contaminants in this wastewater treatment process? Asses the following by running
What does this surface plot indicate? How would you maximise the mineralization of organic contaminants in this wastewater treatment process?
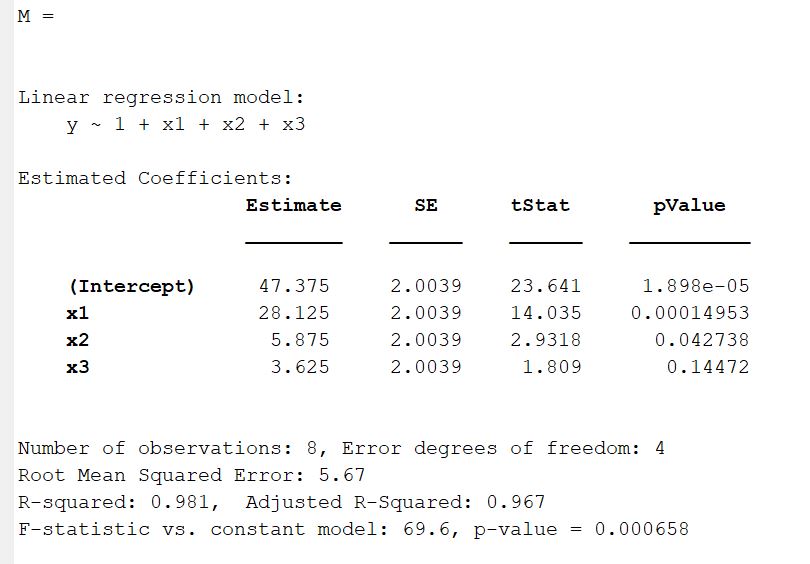
Asses the following by running the matlab code and the plots. Explain with proper reasoning.
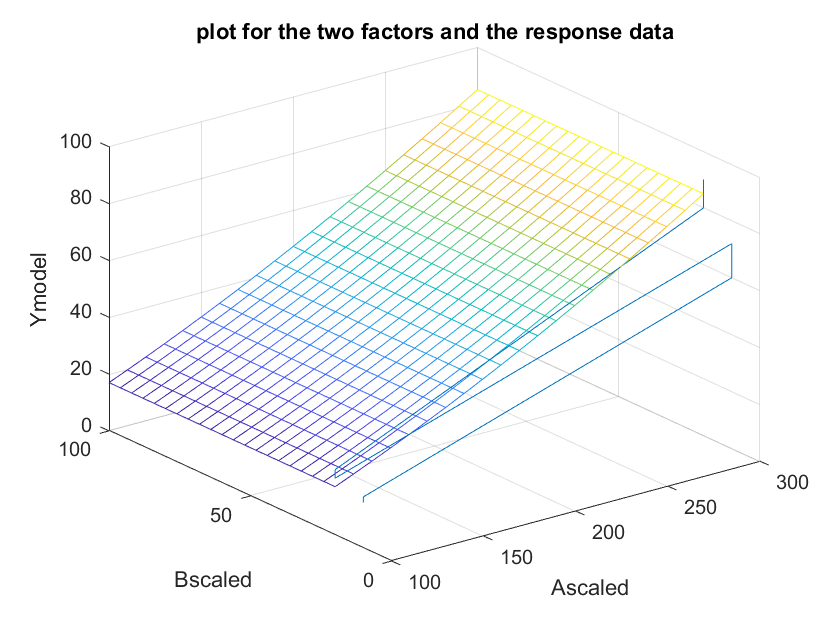
\f\fplot for the two factors and the response data 100 80 Ymodel 60 40 20 0 100 300 50 250 200 150 Bscaled 0 100 Ascaled
Step by Step Solution
There are 3 Steps involved in it
1 Expert Approved Answer
Step: 1 Unlock

Question Has Been Solved by an Expert!
Get step-by-step solutions from verified subject matter experts
Step: 2 Unlock
Step: 3 Unlock